Immigrants from Lebanon vs Immigrants from Malaysia Unemployment Among Ages 60 to 64 years
COMPARE
Immigrants from Lebanon
Immigrants from Malaysia
Unemployment Among Ages 60 to 64 years
Unemployment Among Ages 60 to 64 years Comparison
Immigrants from Lebanon
Immigrants from Malaysia
4.8%
UNEMPLOYMENT AMONG AGES 60 TO 64 YEARS
89.6/ 100
METRIC RATING
131st/ 347
METRIC RANK
4.9%
UNEMPLOYMENT AMONG AGES 60 TO 64 YEARS
44.7/ 100
METRIC RATING
177th/ 347
METRIC RANK
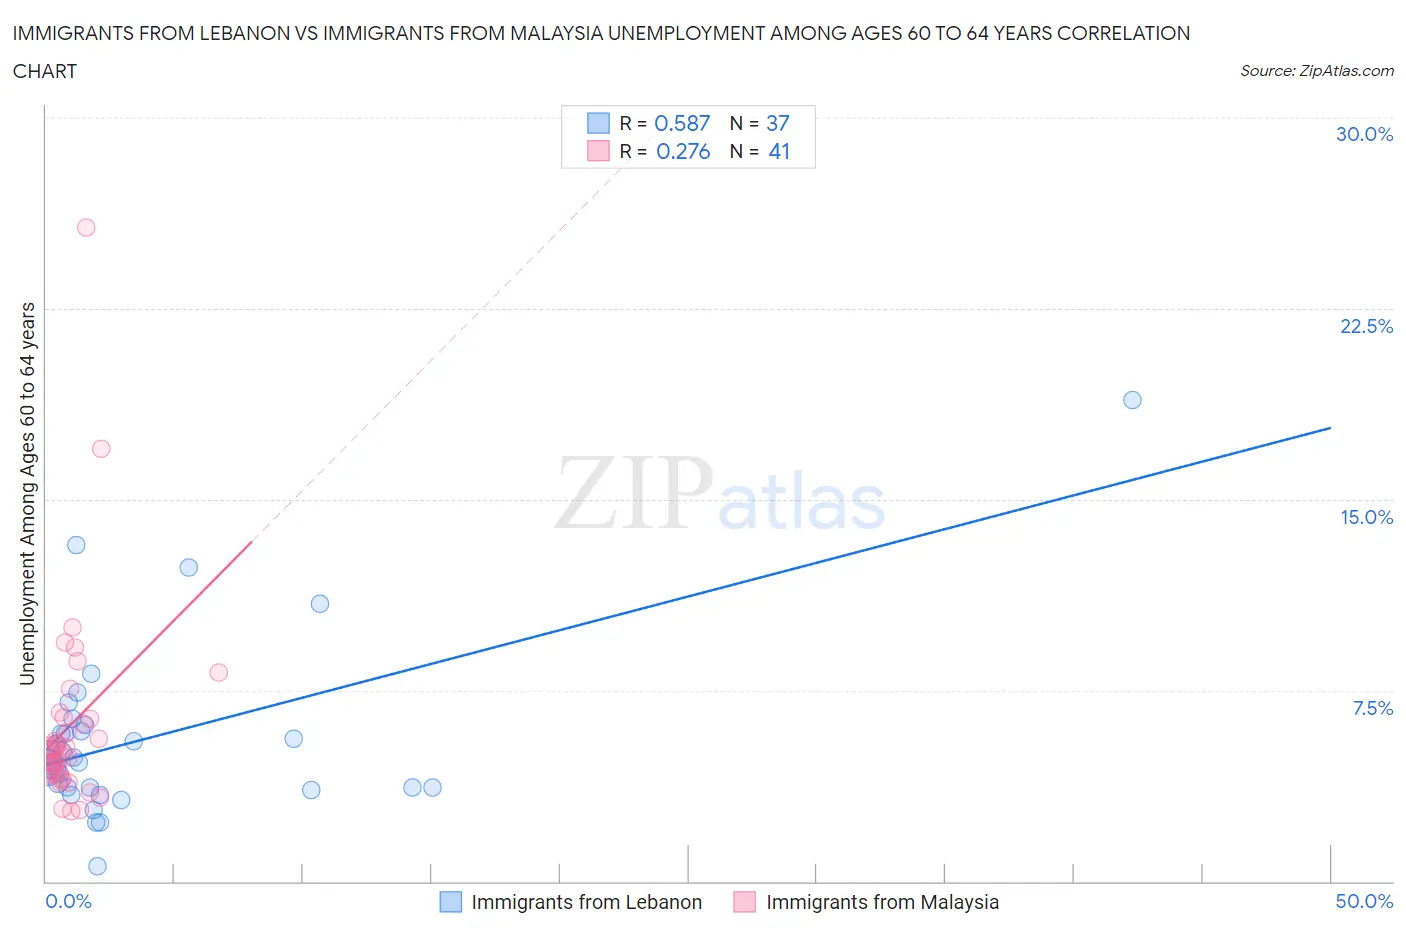
Immigrants from Lebanon vs Immigrants from Malaysia Unemployment Among Ages 60 to 64 years Correlation Chart
The statistical analysis conducted on geographies consisting of 207,036,790 people shows a substantial positive correlation between the proportion of Immigrants from Lebanon and unemployment rate among population between the ages 60 and 64 in the United States with a correlation coefficient (R) of 0.587 and weighted average of 4.8%. Similarly, the statistical analysis conducted on geographies consisting of 188,471,415 people shows a weak positive correlation between the proportion of Immigrants from Malaysia and unemployment rate among population between the ages 60 and 64 in the United States with a correlation coefficient (R) of 0.276 and weighted average of 4.9%, a difference of 2.1%.
Unemployment Among Ages 60 to 64 years Correlation Summary
| Measurement | Immigrants from Lebanon | Immigrants from Malaysia |
| Minimum | 0.60% | 2.7% |
| Maximum | 18.9% | 25.7% |
| Range | 18.3% | 23.0% |
| Mean | 5.6% | 6.1% |
| Median | 4.7% | 5.1% |
| Interquartile 25% (IQ1) | 3.7% | 4.3% |
| Interquartile 75% (IQ3) | 6.0% | 6.4% |
| Interquartile Range (IQR) | 2.3% | 2.1% |
| Standard Deviation (Sample) | 3.4% | 4.0% |
| Standard Deviation (Population) | 3.4% | 4.0% |
Similar Demographics by Unemployment Among Ages 60 to 64 years
Demographics Similar to Immigrants from Lebanon by Unemployment Among Ages 60 to 64 years
In terms of unemployment among ages 60 to 64 years, the demographic groups most similar to Immigrants from Lebanon are Lithuanian (4.8%, a difference of 0.0%), Yaqui (4.8%, a difference of 0.010%), Immigrants from Syria (4.8%, a difference of 0.050%), Immigrants from Serbia (4.8%, a difference of 0.060%), and Choctaw (4.8%, a difference of 0.070%).
| Demographics | Rating | Rank | Unemployment Among Ages 60 to 64 years |
| Immigrants | Senegal | 94.5 /100 | #124 | Exceptional 4.7% |
| Immigrants | Thailand | 93.7 /100 | #125 | Exceptional 4.7% |
| Immigrants | South Central Asia | 93.0 /100 | #126 | Exceptional 4.7% |
| Austrians | 91.9 /100 | #127 | Exceptional 4.8% |
| Choctaw | 90.3 /100 | #128 | Exceptional 4.8% |
| Immigrants | Serbia | 90.2 /100 | #129 | Exceptional 4.8% |
| Immigrants | Syria | 90.1 /100 | #130 | Exceptional 4.8% |
| Immigrants | Lebanon | 89.6 /100 | #131 | Excellent 4.8% |
| Lithuanians | 89.6 /100 | #132 | Excellent 4.8% |
| Yaqui | 89.5 /100 | #133 | Excellent 4.8% |
| Basques | 88.8 /100 | #134 | Excellent 4.8% |
| Pennsylvania Germans | 87.8 /100 | #135 | Excellent 4.8% |
| French Canadians | 87.6 /100 | #136 | Excellent 4.8% |
| Cambodians | 86.9 /100 | #137 | Excellent 4.8% |
| Immigrants | Lithuania | 86.7 /100 | #138 | Excellent 4.8% |
Demographics Similar to Immigrants from Malaysia by Unemployment Among Ages 60 to 64 years
In terms of unemployment among ages 60 to 64 years, the demographic groups most similar to Immigrants from Malaysia are Nonimmigrants (4.9%, a difference of 0.010%), Immigrants from Sweden (4.9%, a difference of 0.010%), Bermudan (4.9%, a difference of 0.070%), Immigrants from Latvia (4.9%, a difference of 0.080%), and Asian (4.9%, a difference of 0.14%).
| Demographics | Rating | Rank | Unemployment Among Ages 60 to 64 years |
| Immigrants | Korea | 54.2 /100 | #170 | Average 4.8% |
| Samoans | 53.6 /100 | #171 | Average 4.9% |
| Immigrants | Turkey | 52.8 /100 | #172 | Average 4.9% |
| Immigrants | Hungary | 50.2 /100 | #173 | Average 4.9% |
| Immigrants | Western Europe | 50.0 /100 | #174 | Average 4.9% |
| Immigrants | Latvia | 46.9 /100 | #175 | Average 4.9% |
| Bermudans | 46.5 /100 | #176 | Average 4.9% |
| Immigrants | Malaysia | 44.7 /100 | #177 | Average 4.9% |
| Immigrants | Nonimmigrants | 44.5 /100 | #178 | Average 4.9% |
| Immigrants | Sweden | 44.3 /100 | #179 | Average 4.9% |
| Asians | 40.8 /100 | #180 | Average 4.9% |
| Hungarians | 40.6 /100 | #181 | Average 4.9% |
| Sri Lankans | 39.8 /100 | #182 | Fair 4.9% |
| Sub-Saharan Africans | 38.9 /100 | #183 | Fair 4.9% |
| Immigrants | Ukraine | 37.6 /100 | #184 | Fair 4.9% |