Immigrants from Lebanon vs Cheyenne Unemployment Among Seniors over 75 years
COMPARE
Immigrants from Lebanon
Cheyenne
Unemployment Among Seniors over 75 years
Unemployment Among Seniors over 75 years Comparison
Immigrants from Lebanon
Cheyenne
8.2%
UNEMPLOYMENT AMONG SENIORS OVER 75 YEARS
98.8/ 100
METRIC RATING
109th/ 347
METRIC RANK
5.9%
UNEMPLOYMENT AMONG SENIORS OVER 75 YEARS
100.0/ 100
METRIC RATING
3rd/ 347
METRIC RANK
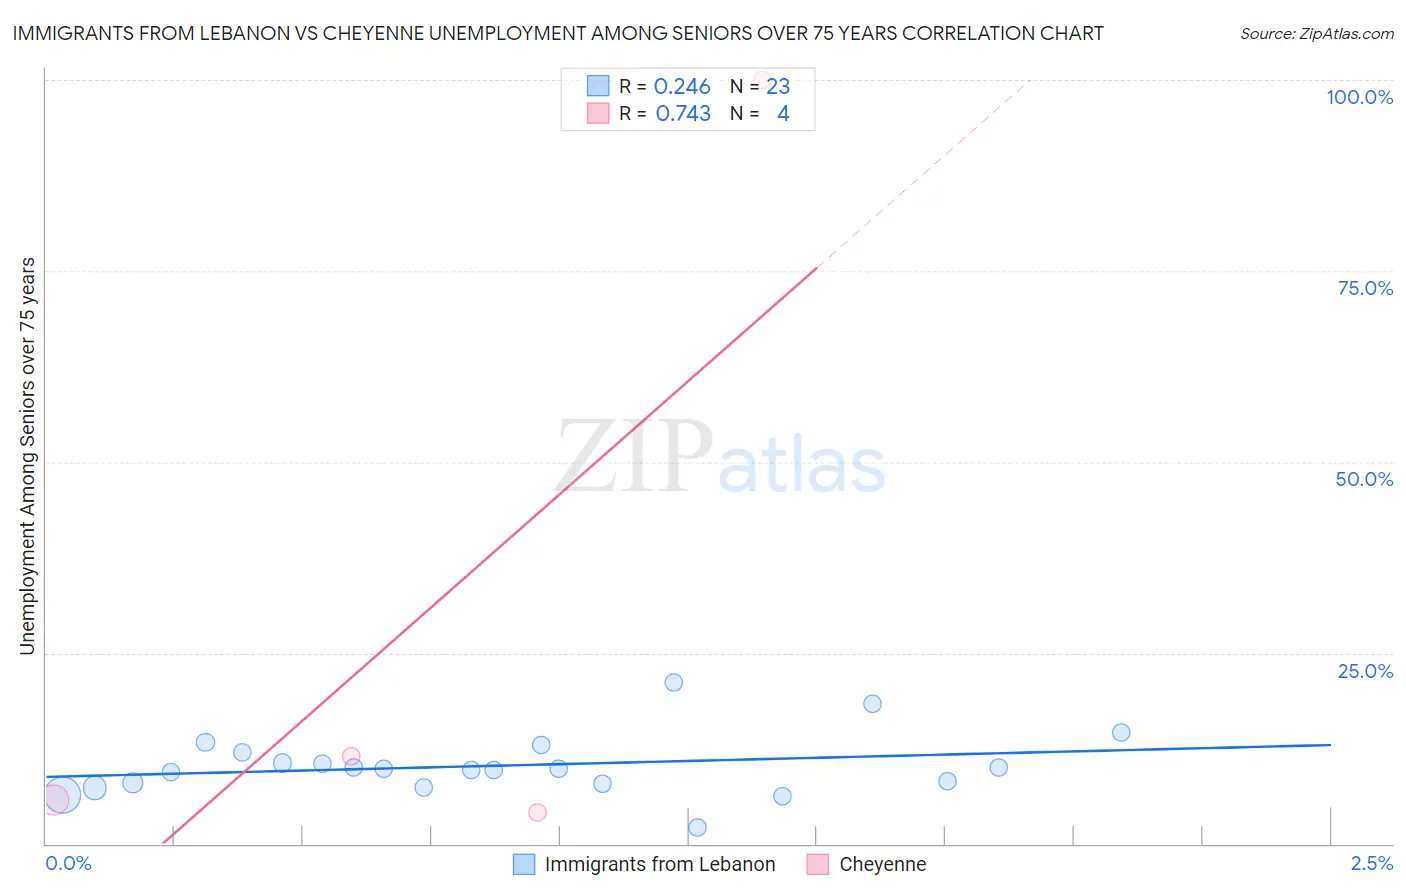
Immigrants from Lebanon vs Cheyenne Unemployment Among Seniors over 75 years Correlation Chart
The statistical analysis conducted on geographies consisting of 140,513,060 people shows a weak positive correlation between the proportion of Immigrants from Lebanon and unemployment rate among seniors over the age of 75 in the United States with a correlation coefficient (R) of 0.246 and weighted average of 8.2%. Similarly, the statistical analysis conducted on geographies consisting of 63,002,461 people shows a strong positive correlation between the proportion of Cheyenne and unemployment rate among seniors over the age of 75 in the United States with a correlation coefficient (R) of 0.743 and weighted average of 5.9%, a difference of 38.5%.
Unemployment Among Seniors over 75 years Correlation Summary
| Measurement | Immigrants from Lebanon | Cheyenne |
| Minimum | 2.1% | 4.1% |
| Maximum | 21.0% | 100.0% |
| Range | 18.9% | 95.9% |
| Mean | 10.2% | 30.4% |
| Median | 9.8% | 8.6% |
| Interquartile 25% (IQ1) | 7.9% | 5.0% |
| Interquartile 75% (IQ3) | 11.9% | 55.8% |
| Interquartile Range (IQR) | 4.0% | 50.8% |
| Standard Deviation (Sample) | 4.0% | 46.5% |
| Standard Deviation (Population) | 3.9% | 40.3% |
Similar Demographics by Unemployment Among Seniors over 75 years
Demographics Similar to Immigrants from Lebanon by Unemployment Among Seniors over 75 years
In terms of unemployment among seniors over 75 years, the demographic groups most similar to Immigrants from Lebanon are Laotian (8.2%, a difference of 0.020%), Marshallese (8.2%, a difference of 0.030%), French American Indian (8.2%, a difference of 0.070%), Sri Lankan (8.2%, a difference of 0.15%), and Immigrants from India (8.2%, a difference of 0.20%).
| Demographics | Rating | Rank | Unemployment Among Seniors over 75 years |
| Immigrants | Panama | 99.1 /100 | #102 | Exceptional 8.2% |
| South American Indians | 99.1 /100 | #103 | Exceptional 8.2% |
| Immigrants | South Central Asia | 99.0 /100 | #104 | Exceptional 8.2% |
| Immigrants | Caribbean | 99.0 /100 | #105 | Exceptional 8.2% |
| Immigrants | Honduras | 99.0 /100 | #106 | Exceptional 8.2% |
| Sri Lankans | 98.9 /100 | #107 | Exceptional 8.2% |
| Laotians | 98.8 /100 | #108 | Exceptional 8.2% |
| Immigrants | Lebanon | 98.8 /100 | #109 | Exceptional 8.2% |
| Marshallese | 98.7 /100 | #110 | Exceptional 8.2% |
| French American Indians | 98.7 /100 | #111 | Exceptional 8.2% |
| Immigrants | India | 98.6 /100 | #112 | Exceptional 8.2% |
| Asians | 98.5 /100 | #113 | Exceptional 8.3% |
| Trinidadians and Tobagonians | 98.4 /100 | #114 | Exceptional 8.3% |
| Sudanese | 98.2 /100 | #115 | Exceptional 8.3% |
| Immigrants | West Indies | 98.1 /100 | #116 | Exceptional 8.3% |
Demographics Similar to Cheyenne by Unemployment Among Seniors over 75 years
In terms of unemployment among seniors over 75 years, the demographic groups most similar to Cheyenne are Chinese (5.9%, a difference of 0.55%), Crow (5.9%, a difference of 0.56%), Alsatian (6.1%, a difference of 2.9%), Hopi (6.3%, a difference of 5.6%), and Immigrants from Armenia (6.5%, a difference of 9.6%).
| Demographics | Rating | Rank | Unemployment Among Seniors over 75 years |
| Crow | 100.0 /100 | #1 | Exceptional 5.9% |
| Chinese | 100.0 /100 | #2 | Exceptional 5.9% |
| Cheyenne | 100.0 /100 | #3 | Exceptional 5.9% |
| Alsatians | 100.0 /100 | #4 | Exceptional 6.1% |
| Hopi | 100.0 /100 | #5 | Exceptional 6.3% |
| Immigrants | Armenia | 100.0 /100 | #6 | Exceptional 6.5% |
| Spanish American Indians | 100.0 /100 | #7 | Exceptional 6.5% |
| Taiwanese | 100.0 /100 | #8 | Exceptional 6.6% |
| Soviet Union | 100.0 /100 | #9 | Exceptional 6.6% |
| Yuman | 100.0 /100 | #10 | Exceptional 6.7% |
| Immigrants | Grenada | 100.0 /100 | #11 | Exceptional 6.7% |
| Comanche | 100.0 /100 | #12 | Exceptional 6.7% |
| Immigrants | Congo | 100.0 /100 | #13 | Exceptional 6.7% |
| Ute | 100.0 /100 | #14 | Exceptional 6.8% |
| Icelanders | 100.0 /100 | #15 | Exceptional 7.0% |