Immigrants from Lebanon vs Brazilian Unemployment Among Ages 20 to 24 years

COMPARE

Immigrants from Lebanon
Race
Ancestry
AfghanAfricanAlaska NativeAlaskan AthabascanAlbanianAleutAlsatianAmericanApacheArabArapahoArgentineanArmenianAssyrian/Chaldean/SyriacAustralianAustrianBahamianBangladeshiBarbadianBasqueBelgianBelizeanBermudanBhutaneseBlackfeetBolivianBritishBritish West IndianBulgarianBurmeseCajunCambodianCanadianCape VerdeanCarpatho RusynCelticCentral AmericanCentral American IndianCherokeeCheyenneChickasawChileanChineseChippewaChoctawColombianColvilleComancheCosta RicanCreeCreekCroatianCrowCubanCypriotCzechCzechoslovakianDanishDelawareDominicanDutchDutch West IndianEastern EuropeanEcuadorianEgyptianEnglishEstonianEthiopianEuropeanFijianFilipinoFinnishFrenchFrench American IndianFrench CanadianGermanGerman RussianGhanaianGreekGuamanian/ChamorroGuatemalanGuyaneseHaitianHmongHonduranHopiHoumaHungarianIcelanderIndian (Asian)IndonesianInupiatIranianIraqiIrishIroquoisIsraeliItalianJamaicanJapaneseJordanianKenyanKiowaKoreanLaotianLatvianLebaneseLiberianLithuanianLumbeeLuxembourgerMacedonianMalaysianMalteseMarshalleseMenomineeMexicanMexican American IndianMongolianMoroccanNative HawaiianNavajoNepaleseNew ZealanderNicaraguanNigerianNorthern EuropeanNorwegianOkinawanOsageOttawaPaiutePakistaniPalestinianPanamanianParaguayanPennsylvania GermanPeruvianPimaPolishPortuguesePotawatomiPuebloPuerto RicanPuget Sound SalishRomanianRussianSalvadoranSamoanScandinavianScotch-IrishScottishSeminoleSenegaleseSerbianShoshoneSierra LeoneanSiouxSlavicSlovakSloveneSomaliSouth AfricanSouth AmericanSouth American IndianSoviet UnionSpaniardSpanishSpanish AmericanSpanish American IndianSri LankanSubsaharan AfricanSudaneseSwedishSwissSyrianTaiwaneseThaiTlingit-HaidaTohono O'OdhamTonganTrinidadian and TobagonianTsimshianTurkishU.S. Virgin IslanderUgandanUkrainianUruguayanUteVenezuelanVietnameseWelshWest IndianYakamaYaquiYugoslavianYumanYup'ikZimbabwean
Immigration
NonimmigrantsImmigrantsAfghanistanAfricaAlbaniaArgentinaArmeniaAsiaAustraliaAustriaBahamasBangladeshBarbadosBelarusBelgiumBelizeBoliviaBosnia and HerzegovinaBrazilBulgariaBurma/MyanmarCabo VerdeCambodiaCameroonCanadaCaribbeanCentral AmericaChileChinaColombiaCongoCosta RicaCroatiaCubaCzechoslovakiaDenmarkDominicaDominican RepublicEastern AfricaEastern AsiaEastern EuropeEcuadorEgyptEl SalvadorEnglandEritreaEthiopiaEuropeFijiFranceGermanyGhanaGreeceGrenadaGuatemalaGuyanaHaitiHondurasHong KongHungaryIndiaIndonesiaIranIraqIrelandIsraelItalyJamaicaJapanJordanKazakhstanKenyaKoreaKuwaitLaosLatin AmericaLatviaLebanonLiberiaLithuaniaMalaysiaMexicoMicronesiaMiddle AfricaMoldovaMoroccoNepalNetherlandsNicaraguaNigeriaNorth AmericaNorth MacedoniaNorthern AfricaNorthern EuropeNorwayOceaniaPakistanPanamaPeruPhilippinesPolandPortugalRomaniaRussiaSaudi ArabiaScotlandSenegalSerbiaSierra LeoneSingaporeSomaliaSouth AfricaSouth AmericaSouth Central AsiaSouth Eastern AsiaSouthern EuropeSpainSri LankaSt. Vincent and the GrenadinesSudanSwedenSwitzerlandSyriaTaiwanThailandTrinidad and TobagoTurkeyUgandaUkraineUruguayUzbekistanVenezuelaVietnamWest IndiesWestern AfricaWestern AsiaWestern EuropeYemenZaireZimbabweAzores
Brazilian
Race
Ancestry
AfghanAfricanAlaska NativeAlaskan AthabascanAlbanianAleutAlsatianAmericanApacheArabArapahoArgentineanArmenianAssyrian/Chaldean/SyriacAustralianAustrianBahamianBangladeshiBarbadianBasqueBelgianBelizeanBermudanBhutaneseBlackfeetBolivianBrazilianBritishBritish West IndianBulgarianBurmeseCajunCambodianCanadianCape VerdeanCarpatho RusynCelticCentral AmericanCentral American IndianCherokeeCheyenneChickasawChileanChineseChippewaChoctawColombianColvilleComancheCosta RicanCreeCreekCroatianCrowCubanCypriotCzechCzechoslovakianDanishDelawareDominicanDutchDutch West IndianEastern EuropeanEcuadorianEgyptianEnglishEstonianEthiopianEuropeanFijianFilipinoFinnishFrenchFrench American IndianFrench CanadianGermanGerman RussianGhanaianGreekGuamanian/ChamorroGuatemalanGuyaneseHaitianHmongHonduranHopiHoumaHungarianIcelanderIndian (Asian)IndonesianInupiatIranianIraqiIrishIroquoisIsraeliItalianJamaicanJapaneseJordanianKenyanKiowaKoreanLaotianLatvianLebaneseLiberianLithuanianLumbeeLuxembourgerMacedonianMalaysianMalteseMarshalleseMenomineeMexicanMexican American IndianMongolianMoroccanNative HawaiianNavajoNepaleseNew ZealanderNicaraguanNigerianNorthern EuropeanNorwegianOkinawanOsageOttawaPaiutePakistaniPalestinianPanamanianParaguayanPennsylvania GermanPeruvianPimaPolishPortuguesePotawatomiPuebloPuerto RicanPuget Sound SalishRomanianRussianSalvadoranSamoanScandinavianScotch-IrishScottishSeminoleSenegaleseSerbianShoshoneSierra LeoneanSiouxSlavicSlovakSloveneSomaliSouth AfricanSouth AmericanSouth American IndianSoviet UnionSpaniardSpanishSpanish AmericanSpanish American IndianSri LankanSubsaharan AfricanSudaneseSwedishSwissSyrianTaiwaneseThaiTlingit-HaidaTohono O'OdhamTonganTrinidadian and TobagonianTsimshianTurkishU.S. Virgin IslanderUgandanUkrainianUruguayanUteVenezuelanVietnameseWelshWest IndianYakamaYaquiYugoslavianYumanYup'ikZimbabwean
Immigration
NonimmigrantsImmigrantsAfghanistanAfricaAlbaniaArgentinaArmeniaAsiaAustraliaAustriaBahamasBangladeshBarbadosBelarusBelgiumBelizeBoliviaBosnia and HerzegovinaBrazilBulgariaBurma/MyanmarCabo VerdeCambodiaCameroonCanadaCaribbeanCentral AmericaChileChinaColombiaCongoCosta RicaCroatiaCubaCzechoslovakiaDenmarkDominicaDominican RepublicEastern AfricaEastern AsiaEastern EuropeEcuadorEgyptEl SalvadorEnglandEritreaEthiopiaEuropeFijiFranceGermanyGhanaGreeceGrenadaGuatemalaGuyanaHaitiHondurasHong KongHungaryIndiaIndonesiaIranIraqIrelandIsraelItalyJamaicaJapanJordanKazakhstanKenyaKoreaKuwaitLaosLatin AmericaLatviaLiberiaLithuaniaMalaysiaMexicoMicronesiaMiddle AfricaMoldovaMoroccoNepalNetherlandsNicaraguaNigeriaNorth AmericaNorth MacedoniaNorthern AfricaNorthern EuropeNorwayOceaniaPakistanPanamaPeruPhilippinesPolandPortugalRomaniaRussiaSaudi ArabiaScotlandSenegalSerbiaSierra LeoneSingaporeSomaliaSouth AfricaSouth AmericaSouth Central AsiaSouth Eastern AsiaSouthern EuropeSpainSri LankaSt. Vincent and the GrenadinesSudanSwedenSwitzerlandSyriaTaiwanThailandTrinidad and TobagoTurkeyUgandaUkraineUruguayUzbekistanVenezuelaVietnamWest IndiesWestern AfricaWestern AsiaWestern EuropeYemenZaireZimbabweAzores
Unemployment Among Ages 20 to 24 years
Income
Poverty
Unemployment
Labor Participation
Family Structure
Vehicle Availability
Education Level
Disability

Unemployment Among Ages 20 to 24 years Comparison

Immigrants from Lebanon

Brazilians

Tragic
Good
10.9%
UNEMPLOYMENT AMONG AGES 20 TO 24 YEARS
0.2/ 100
METRIC RATING
260th/ 347
METRIC RANK
10.2%
UNEMPLOYMENT AMONG AGES 20 TO 24 YEARS
78.4/ 100
METRIC RATING
144th/ 347
METRIC RANK

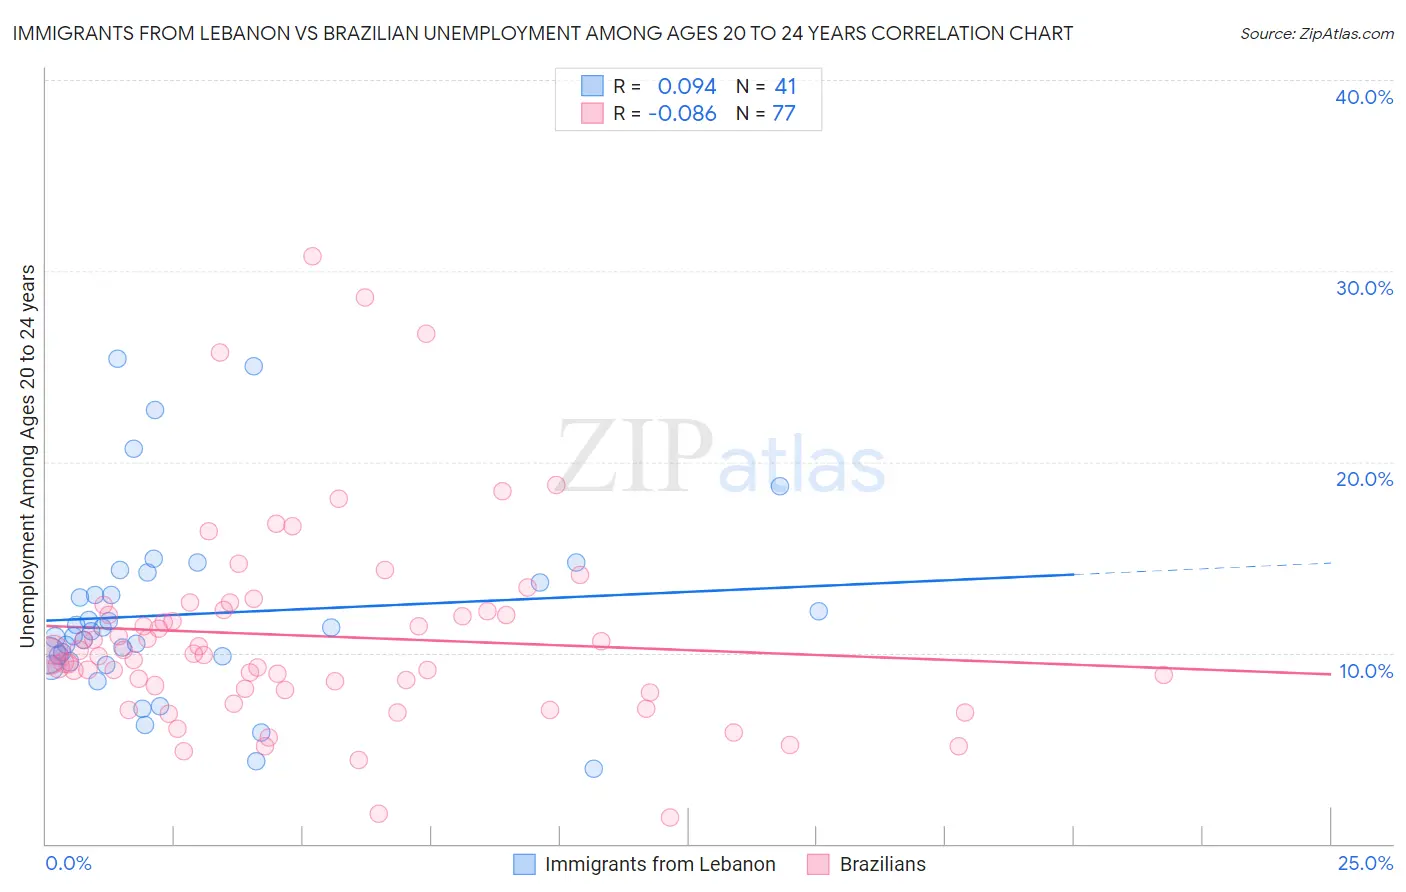
Immigrants from Lebanon vs Brazilian Unemployment Among Ages 20 to 24 years Correlation Chart

The statistical analysis conducted on geographies consisting of 214,292,748 people shows a slight positive correlation between the proportion of Immigrants from Lebanon and unemployment rate among population between the ages 20 and 24 in the United States with a correlation coefficient (R) of 0.094 and weighted average of 10.9%. Similarly, the statistical analysis conducted on geographies consisting of 317,079,134 people shows a slight negative correlation between the proportion of Brazilians and unemployment rate among population between the ages 20 and 24 in the United States with a correlation coefficient (R) of -0.086 and weighted average of 10.2%, a difference of 6.9%.
Immigrants from Lebanon vs Brazilian Unemployment Among Ages 20 to 24 years

Unemployment Among Ages 20 to 24 years Correlation Summary

MeasurementImmigrants from LebanonBrazilian
Minimum3.9%1.4%
Maximum25.4%30.8%
Range21.5%29.4%
Mean12.0%10.9%
Median11.1%9.9%
Interquartile 25% (IQ1)9.7%8.1%
Interquartile 75% (IQ3)13.9%12.2%
Interquartile Range (IQR)4.3%4.1%
Standard Deviation (Sample)4.8%5.3%
Standard Deviation (Population)4.8%5.3%

Similar Demographics by Unemployment Among Ages 20 to 24 years

Demographics Similar to Immigrants from Lebanon by Unemployment Among Ages 20 to 24 years

In terms of unemployment among ages 20 to 24 years, the demographic groups most similar to Immigrants from Lebanon are Panamanian (10.9%, a difference of 0.030%), Dutch West Indian (10.9%, a difference of 0.13%), Immigrants from Western Asia (10.9%, a difference of 0.20%), Puget Sound Salish (10.9%, a difference of 0.24%), and Immigrants from Bahamas (10.9%, a difference of 0.27%).
DemographicsRating | RankUnemployment Among Ages 20 to 24 years
Spanish Americans
0.4
/100
|
#253
Tragic
10.8%
Liberians
0.3
/100
|
#254
Tragic
10.8%
Immigrants | Israel
0.3
/100
|
#255
Tragic
10.8%
Immigrants | Bahamas
0.3
/100
|
#256
Tragic
10.9%
Immigrants | Western Asia
0.3
/100
|
#257
Tragic
10.9%
Dutch West Indians
0.3
/100
|
#258
Tragic
10.9%
Panamanians
0.2
/100
|
#259
Tragic
10.9%
Immigrants | Lebanon
0.2
/100
|
#260
Tragic
10.9%
Puget Sound Salish
0.2
/100
|
#261
Tragic
10.9%
Immigrants | Latin America
0.1
/100
|
#262
Tragic
11.0%
Marshallese
0.1
/100
|
#263
Tragic
11.0%
Sub-Saharan Africans
0.0
/100
|
#264
Tragic
11.1%
Immigrants | Ireland
0.0
/100
|
#265
Tragic
11.1%
Immigrants | Liberia
0.0
/100
|
#266
Tragic
11.1%
Immigrants | Greece
0.0
/100
|
#267
Tragic
11.1%

Demographics Similar to Brazilians by Unemployment Among Ages 20 to 24 years

In terms of unemployment among ages 20 to 24 years, the demographic groups most similar to Brazilians are Argentinean (10.2%, a difference of 0.020%), Immigrants from Jordan (10.2%, a difference of 0.040%), Asian (10.2%, a difference of 0.040%), French Canadian (10.2%, a difference of 0.040%), and Slovak (10.2%, a difference of 0.11%).
DemographicsRating | RankUnemployment Among Ages 20 to 24 years
Immigrants | North America
82.5
/100
|
#137
Excellent
10.2%
Burmese
82.3
/100
|
#138
Excellent
10.2%
Uruguayans
81.9
/100
|
#139
Excellent
10.2%
Immigrants | Austria
81.4
/100
|
#140
Excellent
10.2%
Immigrants | Azores
81.4
/100
|
#141
Excellent
10.2%
Slovaks
80.2
/100
|
#142
Excellent
10.2%
Immigrants | Jordan
79.0
/100
|
#143
Good
10.2%
Brazilians
78.4
/100
|
#144
Good
10.2%
Argentineans
78.0
/100
|
#145
Good
10.2%
Asians
77.7
/100
|
#146
Good
10.2%
French Canadians
77.5
/100
|
#147
Good
10.2%
Immigrants | Romania
75.7
/100
|
#148
Good
10.2%
Immigrants | Scotland
74.6
/100
|
#149
Good
10.2%
Hungarians
74.4
/100
|
#150
Good
10.2%
Immigrants | South Africa
73.6
/100
|
#151
Good
10.2%