Immigrants from Latvia vs Inupiat Unemployment Among Women with Children Under 18 years

COMPARE

Immigrants from Latvia
Race
Ancestry
AfghanAfricanAlaska NativeAlaskan AthabascanAlbanianAleutAlsatianAmericanApacheArabArapahoArgentineanArmenianAssyrian/Chaldean/SyriacAustralianAustrianBahamianBangladeshiBarbadianBasqueBelgianBelizeanBermudanBhutaneseBlackfeetBolivianBrazilianBritishBritish West IndianBulgarianBurmeseCajunCambodianCanadianCape VerdeanCarpatho RusynCelticCentral AmericanCentral American IndianCherokeeCheyenneChickasawChileanChineseChippewaChoctawColombianColvilleComancheCosta RicanCreeCreekCroatianCrowCubanCypriotCzechCzechoslovakianDanishDelawareDominicanDutchDutch West IndianEastern EuropeanEcuadorianEgyptianEnglishEstonianEthiopianEuropeanFijianFilipinoFinnishFrenchFrench American IndianFrench CanadianGermanGerman RussianGhanaianGreekGuamanian/ChamorroGuatemalanGuyaneseHaitianHmongHonduranHopiHoumaHungarianIcelanderIndian (Asian)IndonesianIranianIraqiIrishIroquoisIsraeliItalianJamaicanJapaneseJordanianKenyanKiowaKoreanLaotianLatvianLebaneseLiberianLithuanianLumbeeLuxembourgerMacedonianMalaysianMalteseMarshalleseMenomineeMexicanMexican American IndianMongolianMoroccanNative HawaiianNavajoNepaleseNew ZealanderNicaraguanNigerianNorthern EuropeanNorwegianOkinawanOsageOttawaPaiutePakistaniPalestinianPanamanianParaguayanPennsylvania GermanPeruvianPimaPolishPortuguesePotawatomiPuebloPuerto RicanPuget Sound SalishRomanianRussianSalvadoranSamoanScandinavianScotch-IrishScottishSeminoleSenegaleseSerbianShoshoneSierra LeoneanSiouxSlavicSlovakSloveneSomaliSouth AfricanSouth AmericanSouth American IndianSoviet UnionSpaniardSpanishSpanish AmericanSpanish American IndianSri LankanSubsaharan AfricanSudaneseSwedishSwissSyrianTaiwaneseThaiTlingit-HaidaTohono O'OdhamTonganTrinidadian and TobagonianTsimshianTurkishU.S. Virgin IslanderUgandanUkrainianUruguayanUteVenezuelanVietnameseWelshWest IndianYakamaYaquiYugoslavianYumanYup'ikZimbabwean
Immigration
NonimmigrantsImmigrantsAfghanistanAfricaAlbaniaArgentinaArmeniaAsiaAustraliaAustriaBahamasBangladeshBarbadosBelarusBelgiumBelizeBoliviaBosnia and HerzegovinaBrazilBulgariaBurma/MyanmarCabo VerdeCambodiaCameroonCanadaCaribbeanCentral AmericaChileChinaColombiaCongoCosta RicaCroatiaCubaCzechoslovakiaDenmarkDominicaDominican RepublicEastern AfricaEastern AsiaEastern EuropeEcuadorEgyptEl SalvadorEnglandEritreaEthiopiaEuropeFijiFranceGermanyGhanaGreeceGrenadaGuatemalaGuyanaHaitiHondurasHong KongHungaryIndiaIndonesiaIranIraqIrelandIsraelItalyJamaicaJapanJordanKazakhstanKenyaKoreaKuwaitLaosLatin AmericaLatviaLebanonLiberiaLithuaniaMalaysiaMexicoMicronesiaMiddle AfricaMoldovaMoroccoNepalNetherlandsNicaraguaNigeriaNorth AmericaNorth MacedoniaNorthern AfricaNorthern EuropeNorwayOceaniaPakistanPanamaPeruPhilippinesPolandPortugalRomaniaRussiaSaudi ArabiaScotlandSenegalSerbiaSierra LeoneSingaporeSomaliaSouth AfricaSouth AmericaSouth Central AsiaSouth Eastern AsiaSouthern EuropeSpainSri LankaSt. Vincent and the GrenadinesSudanSwedenSwitzerlandSyriaTaiwanThailandTrinidad and TobagoTurkeyUgandaUkraineUruguayUzbekistanVenezuelaVietnamWest IndiesWestern AfricaWestern AsiaWestern EuropeYemenZaireZimbabweAzores
Inupiat
Race
Ancestry
AfghanAfricanAlaska NativeAlaskan AthabascanAlbanianAleutAlsatianAmericanApacheArabArapahoArgentineanArmenianAssyrian/Chaldean/SyriacAustralianAustrianBahamianBangladeshiBarbadianBasqueBelgianBelizeanBermudanBhutaneseBlackfeetBolivianBrazilianBritishBritish West IndianBulgarianBurmeseCajunCambodianCanadianCape VerdeanCarpatho RusynCelticCentral AmericanCentral American IndianCherokeeCheyenneChickasawChileanChineseChippewaChoctawColombianColvilleComancheCosta RicanCreeCreekCroatianCrowCubanCypriotCzechCzechoslovakianDanishDelawareDominicanDutchDutch West IndianEastern EuropeanEcuadorianEgyptianEnglishEstonianEthiopianEuropeanFijianFilipinoFinnishFrenchFrench American IndianFrench CanadianGermanGerman RussianGhanaianGreekGuamanian/ChamorroGuatemalanGuyaneseHaitianHmongHonduranHopiHoumaHungarianIcelanderIndian (Asian)IndonesianInupiatIranianIraqiIrishIroquoisIsraeliItalianJamaicanJapaneseJordanianKenyanKiowaKoreanLaotianLatvianLebaneseLiberianLithuanianLumbeeLuxembourgerMacedonianMalaysianMalteseMarshalleseMenomineeMexicanMexican American IndianMongolianMoroccanNative HawaiianNavajoNepaleseNew ZealanderNicaraguanNigerianNorthern EuropeanNorwegianOkinawanOsageOttawaPaiutePakistaniPalestinianPanamanianParaguayanPennsylvania GermanPeruvianPimaPolishPortuguesePotawatomiPuebloPuerto RicanPuget Sound SalishRomanianRussianSalvadoranSamoanScandinavianScotch-IrishScottishSeminoleSenegaleseSerbianShoshoneSierra LeoneanSiouxSlavicSlovakSloveneSomaliSouth AfricanSouth AmericanSouth American IndianSoviet UnionSpaniardSpanishSpanish AmericanSpanish American IndianSri LankanSubsaharan AfricanSudaneseSwedishSwissSyrianTaiwaneseThaiTlingit-HaidaTohono O'OdhamTonganTrinidadian and TobagonianTsimshianTurkishU.S. Virgin IslanderUgandanUkrainianUruguayanUteVenezuelanVietnameseWelshWest IndianYakamaYaquiYugoslavianYumanYup'ikZimbabwean
Immigration
NonimmigrantsImmigrantsAfghanistanAfricaAlbaniaArgentinaArmeniaAsiaAustraliaAustriaBahamasBangladeshBarbadosBelarusBelgiumBelizeBoliviaBosnia and HerzegovinaBrazilBulgariaBurma/MyanmarCabo VerdeCambodiaCameroonCanadaCaribbeanCentral AmericaChileChinaColombiaCongoCosta RicaCroatiaCubaCzechoslovakiaDenmarkDominicaDominican RepublicEastern AfricaEastern AsiaEastern EuropeEcuadorEgyptEl SalvadorEnglandEritreaEthiopiaEuropeFijiFranceGermanyGhanaGreeceGrenadaGuatemalaGuyanaHaitiHondurasHong KongHungaryIndiaIndonesiaIranIraqIrelandIsraelItalyJamaicaJapanJordanKazakhstanKenyaKoreaKuwaitLaosLatin AmericaLebanonLiberiaLithuaniaMalaysiaMexicoMicronesiaMiddle AfricaMoldovaMoroccoNepalNetherlandsNicaraguaNigeriaNorth AmericaNorth MacedoniaNorthern AfricaNorthern EuropeNorwayOceaniaPakistanPanamaPeruPhilippinesPolandPortugalRomaniaRussiaSaudi ArabiaScotlandSenegalSerbiaSierra LeoneSingaporeSomaliaSouth AfricaSouth AmericaSouth Central AsiaSouth Eastern AsiaSouthern EuropeSpainSri LankaSt. Vincent and the GrenadinesSudanSwedenSwitzerlandSyriaTaiwanThailandTrinidad and TobagoTurkeyUgandaUkraineUruguayUzbekistanVenezuelaVietnamWest IndiesWestern AfricaWestern AsiaWestern EuropeYemenZaireZimbabweAzores
Unemployment Among Women with Children Under 18 years
Income
Poverty
Unemployment
Labor Participation
Family Structure
Vehicle Availability
Education Level
Disability

Unemployment Among Women with Children Under 18 years Comparison

Immigrants from Latvia

Inupiat

Good
Tragic
5.4%
UNEMPLOYMENT AMONG WOMEN WITH CHILDREN UNDER 18 YEARS
70.8/ 100
METRIC RATING
154th/ 347
METRIC RANK
9.6%
UNEMPLOYMENT AMONG WOMEN WITH CHILDREN UNDER 18 YEARS
0.0/ 100
METRIC RATING
344th/ 347
METRIC RANK

Immigrants from Latvia vs Inupiat Unemployment Among Women with Children Under 18 years Correlation Chart

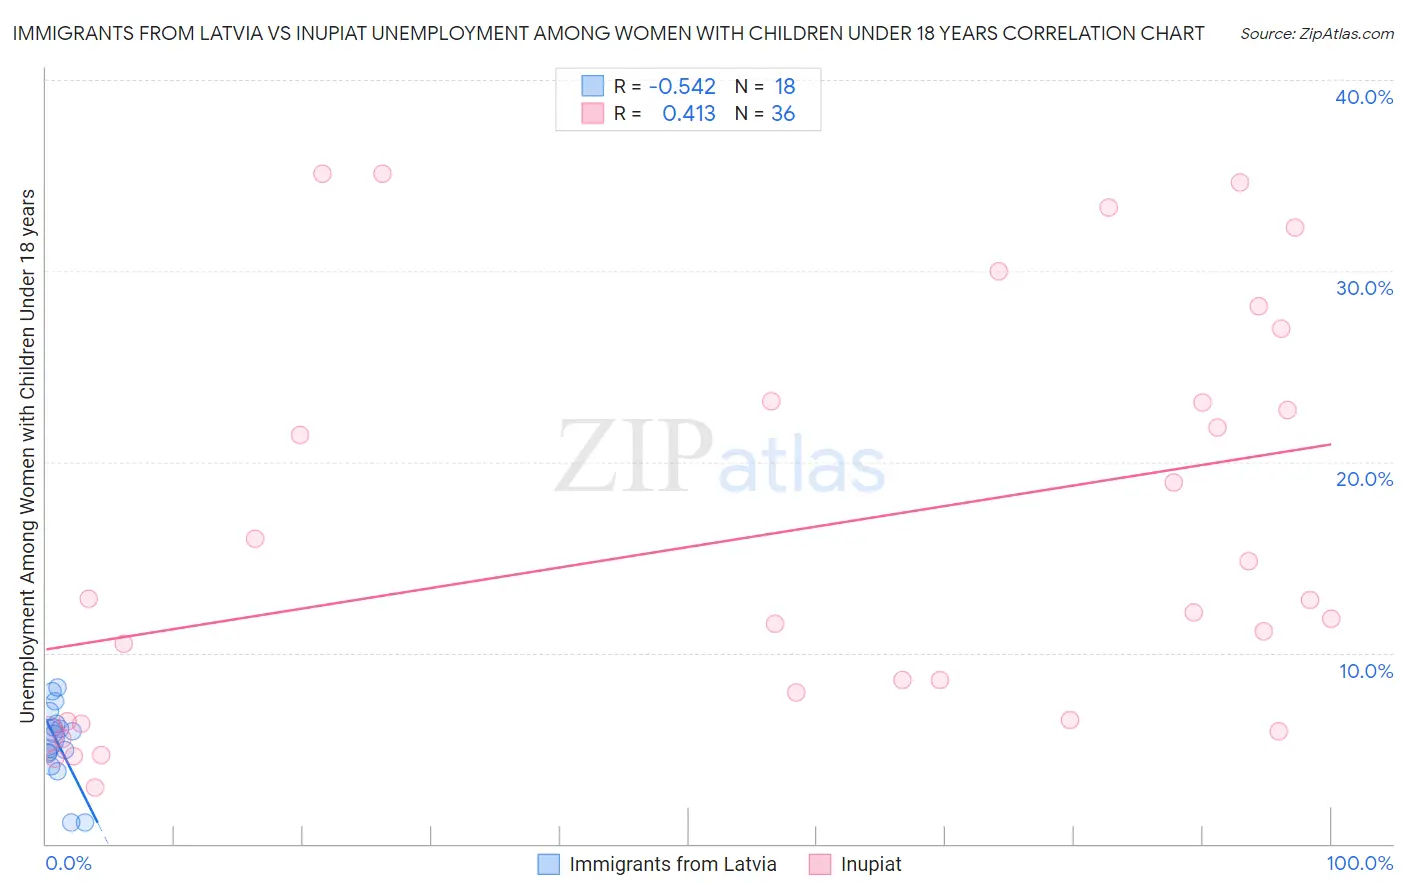
The statistical analysis conducted on geographies consisting of 112,221,159 people shows a substantial negative correlation between the proportion of Immigrants from Latvia and unemployment rate among women with children under the age of 18 in the United States with a correlation coefficient (R) of -0.542 and weighted average of 5.4%. Similarly, the statistical analysis conducted on geographies consisting of 94,720,534 people shows a moderate positive correlation between the proportion of Inupiat and unemployment rate among women with children under the age of 18 in the United States with a correlation coefficient (R) of 0.413 and weighted average of 9.6%, a difference of 78.7%.
Immigrants from Latvia vs Inupiat Unemployment Among Women with Children Under 18 years

Unemployment Among Women with Children Under 18 years Correlation Summary

MeasurementImmigrants from LatviaInupiat
Minimum1.1%2.9%
Maximum8.2%35.1%
Range7.1%32.2%
Mean5.3%16.1%
Median5.7%12.4%
Interquartile 25% (IQ1)4.7%6.5%
Interquartile 75% (IQ3)6.3%23.1%
Interquartile Range (IQR)1.6%16.7%
Standard Deviation (Sample)2.0%10.4%
Standard Deviation (Population)1.9%10.3%

Similar Demographics by Unemployment Among Women with Children Under 18 years

Demographics Similar to Immigrants from Latvia by Unemployment Among Women with Children Under 18 years

In terms of unemployment among women with children under 18 years, the demographic groups most similar to Immigrants from Latvia are Carpatho Rusyn (5.4%, a difference of 0.0%), Korean (5.4%, a difference of 0.020%), Immigrants from Iran (5.4%, a difference of 0.030%), Immigrants from South Eastern Asia (5.4%, a difference of 0.030%), and South African (5.4%, a difference of 0.040%).
DemographicsRating | RankUnemployment Among Women with Children Under 18 years
Bangladeshis
73.2
/100
|
#147
Good
5.3%
Immigrants | Western Europe
72.8
/100
|
#148
Good
5.4%
Immigrants | Kenya
72.2
/100
|
#149
Good
5.4%
Immigrants | Argentina
71.7
/100
|
#150
Good
5.4%
Immigrants | Iran
71.1
/100
|
#151
Good
5.4%
Immigrants | South Eastern Asia
71.1
/100
|
#152
Good
5.4%
Carpatho Rusyns
70.8
/100
|
#153
Good
5.4%
Immigrants | Latvia
70.8
/100
|
#154
Good
5.4%
Koreans
70.5
/100
|
#155
Good
5.4%
South Africans
70.3
/100
|
#156
Good
5.4%
German Russians
70.2
/100
|
#157
Good
5.4%
Immigrants | Burma/Myanmar
69.5
/100
|
#158
Good
5.4%
Chickasaw
68.4
/100
|
#159
Good
5.4%
Afghans
66.6
/100
|
#160
Good
5.4%
Immigrants | Iraq
65.9
/100
|
#161
Good
5.4%

Demographics Similar to Inupiat by Unemployment Among Women with Children Under 18 years

In terms of unemployment among women with children under 18 years, the demographic groups most similar to Inupiat are Yuman (9.8%, a difference of 1.9%), Arapaho (9.2%, a difference of 4.2%), Puerto Rican (9.0%, a difference of 6.4%), Tohono O'odham (8.9%, a difference of 8.1%), and Yup'ik (11.0%, a difference of 15.1%).
DemographicsRating | RankUnemployment Among Women with Children Under 18 years
Immigrants | Dominican Republic
0.0
/100
|
#333
Tragic
7.5%
Cheyenne
0.0
/100
|
#334
Tragic
7.8%
Apache
0.0
/100
|
#335
Tragic
7.9%
Sioux
0.0
/100
|
#336
Tragic
7.9%
Yakama
0.0
/100
|
#337
Tragic
8.1%
Immigrants | Yemen
0.0
/100
|
#338
Tragic
8.2%
Navajo
0.0
/100
|
#339
Tragic
8.2%
Crow
0.0
/100
|
#340
Tragic
8.2%
Tohono O'odham
0.0
/100
|
#341
Tragic
8.9%
Puerto Ricans
0.0
/100
|
#342
Tragic
9.0%
Arapaho
0.0
/100
|
#343
Tragic
9.2%
Inupiat
0.0
/100
|
#344
Tragic
9.6%
Yuman
0.0
/100
|
#345
Tragic
9.8%
Yup'ik
0.0
/100
|
#346
Tragic
11.0%
Pima
0.0
/100
|
#347
Tragic
11.7%