Immigrants from Latvia vs Immigrants from Northern Africa Unemployment Among Ages 60 to 64 years

COMPARE

Immigrants from Latvia
Race
Ancestry
AfghanAfricanAlaska NativeAlaskan AthabascanAlbanianAleutAlsatianAmericanApacheArabArapahoArgentineanArmenianAssyrian/Chaldean/SyriacAustralianAustrianBahamianBangladeshiBarbadianBasqueBelgianBelizeanBermudanBhutaneseBlackfeetBolivianBrazilianBritishBritish West IndianBulgarianBurmeseCajunCambodianCanadianCape VerdeanCarpatho RusynCelticCentral AmericanCentral American IndianCherokeeCheyenneChickasawChileanChineseChippewaChoctawColombianColvilleComancheCosta RicanCreeCreekCroatianCrowCubanCypriotCzechCzechoslovakianDanishDelawareDominicanDutchDutch West IndianEastern EuropeanEcuadorianEgyptianEnglishEstonianEthiopianEuropeanFijianFilipinoFinnishFrenchFrench American IndianFrench CanadianGermanGerman RussianGhanaianGreekGuamanian/ChamorroGuatemalanGuyaneseHaitianHmongHonduranHopiHoumaHungarianIcelanderIndian (Asian)IndonesianInupiatIranianIraqiIrishIroquoisIsraeliItalianJamaicanJapaneseJordanianKenyanKiowaKoreanLaotianLatvianLebaneseLiberianLithuanianLumbeeLuxembourgerMacedonianMalaysianMalteseMarshalleseMenomineeMexicanMexican American IndianMongolianMoroccanNative HawaiianNavajoNepaleseNew ZealanderNicaraguanNigerianNorthern EuropeanNorwegianOkinawanOsageOttawaPaiutePakistaniPalestinianPanamanianParaguayanPennsylvania GermanPeruvianPimaPolishPortuguesePotawatomiPuebloPuerto RicanPuget Sound SalishRomanianRussianSalvadoranSamoanScandinavianScotch-IrishScottishSeminoleSenegaleseSerbianShoshoneSierra LeoneanSiouxSlavicSlovakSloveneSomaliSouth AfricanSouth AmericanSouth American IndianSoviet UnionSpaniardSpanishSpanish AmericanSpanish American IndianSri LankanSubsaharan AfricanSudaneseSwedishSwissSyrianTaiwaneseThaiTlingit-HaidaTohono O'OdhamTonganTrinidadian and TobagonianTsimshianTurkishU.S. Virgin IslanderUgandanUkrainianUruguayanUteVenezuelanVietnameseWelshWest IndianYakamaYaquiYugoslavianYumanYup'ikZimbabwean
Immigration
NonimmigrantsImmigrantsAfghanistanAfricaAlbaniaArgentinaArmeniaAsiaAustraliaAustriaBahamasBangladeshBarbadosBelarusBelgiumBelizeBoliviaBosnia and HerzegovinaBrazilBulgariaBurma/MyanmarCabo VerdeCambodiaCameroonCanadaCaribbeanCentral AmericaChileChinaColombiaCongoCosta RicaCroatiaCubaCzechoslovakiaDenmarkDominicaDominican RepublicEastern AfricaEastern AsiaEastern EuropeEcuadorEgyptEl SalvadorEnglandEritreaEthiopiaEuropeFijiFranceGermanyGhanaGreeceGrenadaGuatemalaGuyanaHaitiHondurasHong KongHungaryIndiaIndonesiaIranIraqIrelandIsraelItalyJamaicaJapanJordanKazakhstanKenyaKoreaKuwaitLaosLatin AmericaLatviaLebanonLiberiaLithuaniaMalaysiaMexicoMicronesiaMiddle AfricaMoldovaMoroccoNepalNetherlandsNicaraguaNigeriaNorth AmericaNorth MacedoniaNorthern EuropeNorwayOceaniaPakistanPanamaPeruPhilippinesPolandPortugalRomaniaRussiaSaudi ArabiaScotlandSenegalSerbiaSierra LeoneSingaporeSomaliaSouth AfricaSouth AmericaSouth Central AsiaSouth Eastern AsiaSouthern EuropeSpainSri LankaSt. Vincent and the GrenadinesSudanSwedenSwitzerlandSyriaTaiwanThailandTrinidad and TobagoTurkeyUgandaUkraineUruguayUzbekistanVenezuelaVietnamWest IndiesWestern AfricaWestern AsiaWestern EuropeYemenZaireZimbabweAzores
Immigrants from Northern Africa
Race
Ancestry
AfghanAfricanAlaska NativeAlaskan AthabascanAlbanianAleutAlsatianAmericanApacheArabArapahoArgentineanArmenianAssyrian/Chaldean/SyriacAustralianAustrianBahamianBangladeshiBarbadianBasqueBelgianBelizeanBermudanBhutaneseBlackfeetBolivianBrazilianBritishBritish West IndianBulgarianBurmeseCajunCambodianCanadianCape VerdeanCarpatho RusynCelticCentral AmericanCentral American IndianCherokeeCheyenneChickasawChileanChineseChippewaChoctawColombianColvilleComancheCosta RicanCreeCreekCroatianCrowCubanCypriotCzechCzechoslovakianDanishDelawareDominicanDutchDutch West IndianEastern EuropeanEcuadorianEgyptianEnglishEstonianEthiopianEuropeanFijianFilipinoFinnishFrenchFrench American IndianFrench CanadianGermanGerman RussianGhanaianGreekGuamanian/ChamorroGuatemalanGuyaneseHaitianHmongHonduranHopiHoumaHungarianIcelanderIndian (Asian)IndonesianInupiatIranianIraqiIrishIroquoisIsraeliItalianJamaicanJapaneseJordanianKenyanKiowaKoreanLaotianLatvianLebaneseLiberianLithuanianLumbeeLuxembourgerMacedonianMalaysianMalteseMarshalleseMenomineeMexicanMexican American IndianMongolianMoroccanNative HawaiianNavajoNepaleseNew ZealanderNicaraguanNigerianNorthern EuropeanNorwegianOkinawanOsageOttawaPaiutePakistaniPalestinianPanamanianParaguayanPennsylvania GermanPeruvianPimaPolishPortuguesePotawatomiPuebloPuerto RicanPuget Sound SalishRomanianRussianSalvadoranSamoanScandinavianScotch-IrishScottishSeminoleSenegaleseSerbianShoshoneSierra LeoneanSiouxSlavicSlovakSloveneSomaliSouth AfricanSouth AmericanSouth American IndianSoviet UnionSpaniardSpanishSpanish AmericanSpanish American IndianSri LankanSubsaharan AfricanSudaneseSwedishSwissSyrianTaiwaneseThaiTlingit-HaidaTohono O'OdhamTonganTrinidadian and TobagonianTsimshianTurkishU.S. Virgin IslanderUgandanUkrainianUruguayanUteVenezuelanVietnameseWelshWest IndianYakamaYaquiYugoslavianYumanYup'ikZimbabwean
Immigration
NonimmigrantsImmigrantsAfghanistanAfricaAlbaniaArgentinaArmeniaAsiaAustraliaAustriaBahamasBangladeshBarbadosBelarusBelgiumBelizeBoliviaBosnia and HerzegovinaBrazilBulgariaBurma/MyanmarCabo VerdeCambodiaCameroonCanadaCaribbeanCentral AmericaChileChinaColombiaCongoCosta RicaCroatiaCubaCzechoslovakiaDenmarkDominicaDominican RepublicEastern AfricaEastern AsiaEastern EuropeEcuadorEgyptEl SalvadorEnglandEritreaEthiopiaEuropeFijiFranceGermanyGhanaGreeceGrenadaGuatemalaGuyanaHaitiHondurasHong KongHungaryIndiaIndonesiaIranIraqIrelandIsraelItalyJamaicaJapanJordanKazakhstanKenyaKoreaKuwaitLaosLatin AmericaLebanonLiberiaLithuaniaMalaysiaMexicoMicronesiaMiddle AfricaMoldovaMoroccoNepalNetherlandsNicaraguaNigeriaNorth AmericaNorth MacedoniaNorthern AfricaNorthern EuropeNorwayOceaniaPakistanPanamaPeruPhilippinesPolandPortugalRomaniaRussiaSaudi ArabiaScotlandSenegalSerbiaSierra LeoneSingaporeSomaliaSouth AfricaSouth AmericaSouth Central AsiaSouth Eastern AsiaSouthern EuropeSpainSri LankaSt. Vincent and the GrenadinesSudanSwedenSwitzerlandSyriaTaiwanThailandTrinidad and TobagoTurkeyUgandaUkraineUruguayUzbekistanVenezuelaVietnamWest IndiesWestern AfricaWestern AsiaWestern EuropeYemenZaireZimbabweAzores
Unemployment Among Ages 60 to 64 years
Income
Poverty
Unemployment
Labor Participation
Family Structure
Vehicle Availability
Education Level
Disability

Unemployment Among Ages 60 to 64 years Comparison

Immigrants from Latvia

Immigrants from Northern Africa

Average
Exceptional
4.9%
UNEMPLOYMENT AMONG AGES 60 TO 64 YEARS
46.9/ 100
METRIC RATING
175th/ 347
METRIC RANK
4.7%
UNEMPLOYMENT AMONG AGES 60 TO 64 YEARS
98.7/ 100
METRIC RATING
89th/ 347
METRIC RANK

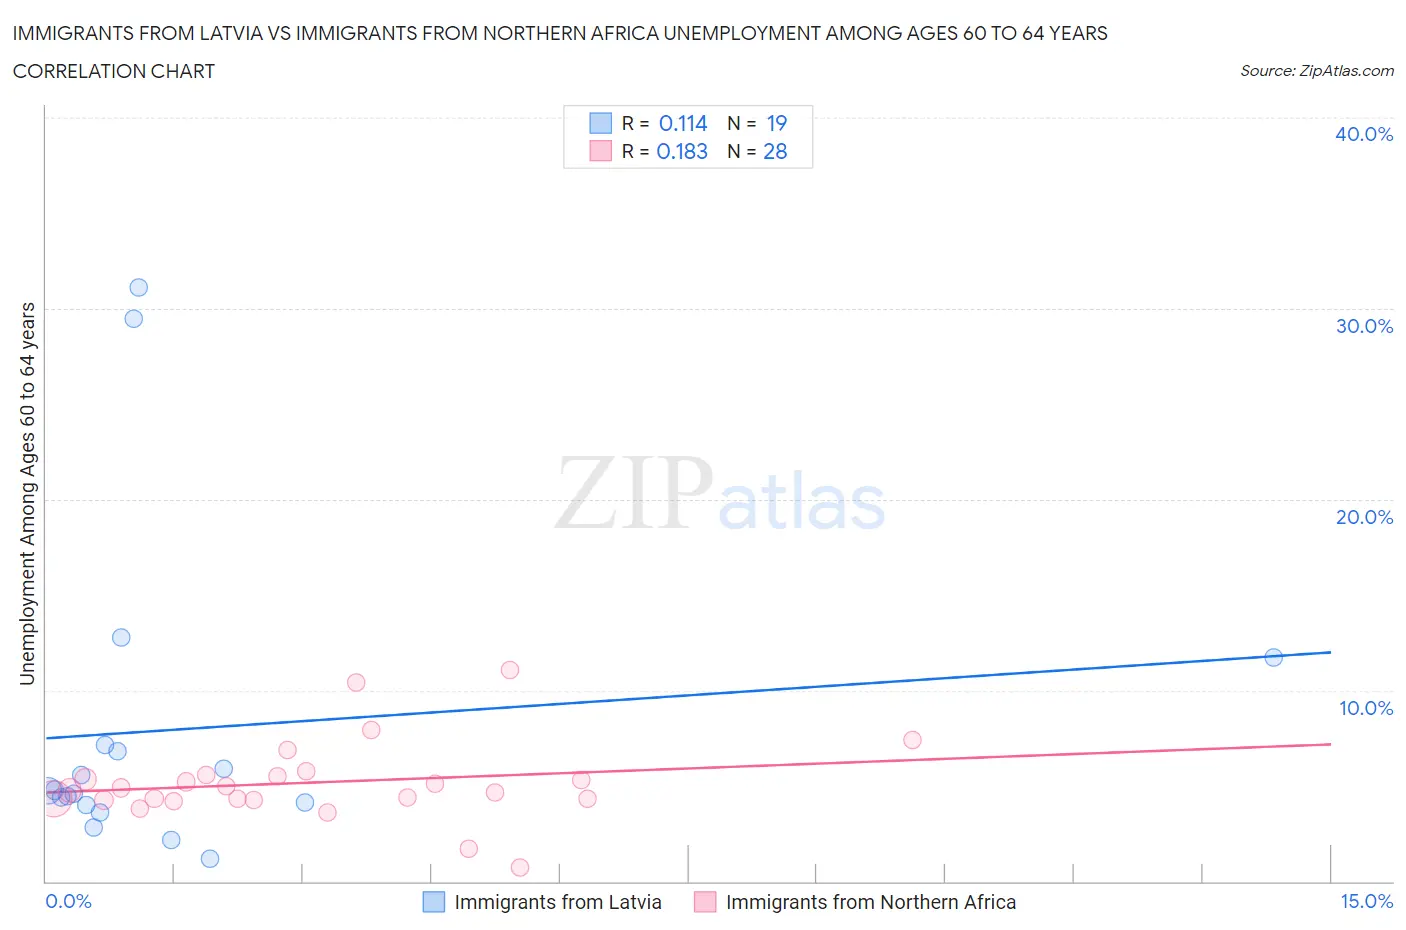
Immigrants from Latvia vs Immigrants from Northern Africa Unemployment Among Ages 60 to 64 years Correlation Chart

The statistical analysis conducted on geographies consisting of 110,048,532 people shows a poor positive correlation between the proportion of Immigrants from Latvia and unemployment rate among population between the ages 60 and 64 in the United States with a correlation coefficient (R) of 0.114 and weighted average of 4.9%. Similarly, the statistical analysis conducted on geographies consisting of 300,447,465 people shows a poor positive correlation between the proportion of Immigrants from Northern Africa and unemployment rate among population between the ages 60 and 64 in the United States with a correlation coefficient (R) of 0.183 and weighted average of 4.7%, a difference of 4.1%.
Immigrants from Latvia vs Immigrants from Northern Africa Unemployment Among Ages 60 to 64 years

Unemployment Among Ages 60 to 64 years Correlation Summary

MeasurementImmigrants from LatviaImmigrants from Northern Africa
Minimum1.2%0.70%
Maximum31.1%11.0%
Range29.9%10.3%
Mean8.0%5.2%
Median4.7%4.8%
Interquartile 25% (IQ1)4.0%4.3%
Interquartile 75% (IQ3)7.1%5.5%
Interquartile Range (IQR)3.1%1.3%
Standard Deviation (Sample)8.4%2.1%
Standard Deviation (Population)8.1%2.1%

Similar Demographics by Unemployment Among Ages 60 to 64 years

Demographics Similar to Immigrants from Latvia by Unemployment Among Ages 60 to 64 years

In terms of unemployment among ages 60 to 64 years, the demographic groups most similar to Immigrants from Latvia are Bermudan (4.9%, a difference of 0.010%), Immigrants from Malaysia (4.9%, a difference of 0.080%), Nonimmigrants (4.9%, a difference of 0.080%), Immigrants from Sweden (4.9%, a difference of 0.090%), and Immigrants from Western Europe (4.9%, a difference of 0.11%).
DemographicsRating | RankUnemployment Among Ages 60 to 64 years
Immigrants | Southern Europe
56.7
/100
|
#168
Average
4.8%
Immigrants | France
55.5
/100
|
#169
Average
4.8%
Immigrants | Korea
54.2
/100
|
#170
Average
4.8%
Samoans
53.6
/100
|
#171
Average
4.9%
Immigrants | Turkey
52.8
/100
|
#172
Average
4.9%
Immigrants | Hungary
50.2
/100
|
#173
Average
4.9%
Immigrants | Western Europe
50.0
/100
|
#174
Average
4.9%
Immigrants | Latvia
46.9
/100
|
#175
Average
4.9%
Bermudans
46.5
/100
|
#176
Average
4.9%
Immigrants | Malaysia
44.7
/100
|
#177
Average
4.9%
Immigrants | Nonimmigrants
44.5
/100
|
#178
Average
4.9%
Immigrants | Sweden
44.3
/100
|
#179
Average
4.9%
Asians
40.8
/100
|
#180
Average
4.9%
Hungarians
40.6
/100
|
#181
Average
4.9%
Sri Lankans
39.8
/100
|
#182
Fair
4.9%

Demographics Similar to Immigrants from Northern Africa by Unemployment Among Ages 60 to 64 years

In terms of unemployment among ages 60 to 64 years, the demographic groups most similar to Immigrants from Northern Africa are Immigrants from Bulgaria (4.7%, a difference of 0.0%), Immigrants from Liberia (4.7%, a difference of 0.050%), Immigrants from Jordan (4.7%, a difference of 0.070%), Immigrants from Oceania (4.7%, a difference of 0.11%), and Thai (4.7%, a difference of 0.13%).
DemographicsRating | RankUnemployment Among Ages 60 to 64 years
Okinawans
99.1
/100
|
#82
Exceptional
4.7%
Immigrants | Egypt
99.1
/100
|
#83
Exceptional
4.7%
Thais
98.9
/100
|
#84
Exceptional
4.7%
Immigrants | Sri Lanka
98.9
/100
|
#85
Exceptional
4.7%
Immigrants | Oceania
98.9
/100
|
#86
Exceptional
4.7%
Immigrants | Jordan
98.8
/100
|
#87
Exceptional
4.7%
Immigrants | Bulgaria
98.7
/100
|
#88
Exceptional
4.7%
Immigrants | Northern Africa
98.7
/100
|
#89
Exceptional
4.7%
Immigrants | Liberia
98.7
/100
|
#90
Exceptional
4.7%
Immigrants | Uganda
98.4
/100
|
#91
Exceptional
4.7%
Romanians
98.4
/100
|
#92
Exceptional
4.7%
Immigrants | Saudi Arabia
98.3
/100
|
#93
Exceptional
4.7%
Immigrants | Kuwait
98.3
/100
|
#94
Exceptional
4.7%
Serbians
98.2
/100
|
#95
Exceptional
4.7%
Poles
98.1
/100
|
#96
Exceptional
4.7%