Immigrants from Latvia vs Immigrants from Dominican Republic Male Unemployment
COMPARE
Immigrants from Latvia
Immigrants from Dominican Republic
Male Unemployment
Male Unemployment Comparison
Immigrants from Latvia
Immigrants from Dominican Republic
5.1%
MALE UNEMPLOYMENT
87.5/ 100
METRIC RATING
124th/ 347
METRIC RANK
7.6%
MALE UNEMPLOYMENT
0.0/ 100
METRIC RATING
326th/ 347
METRIC RANK
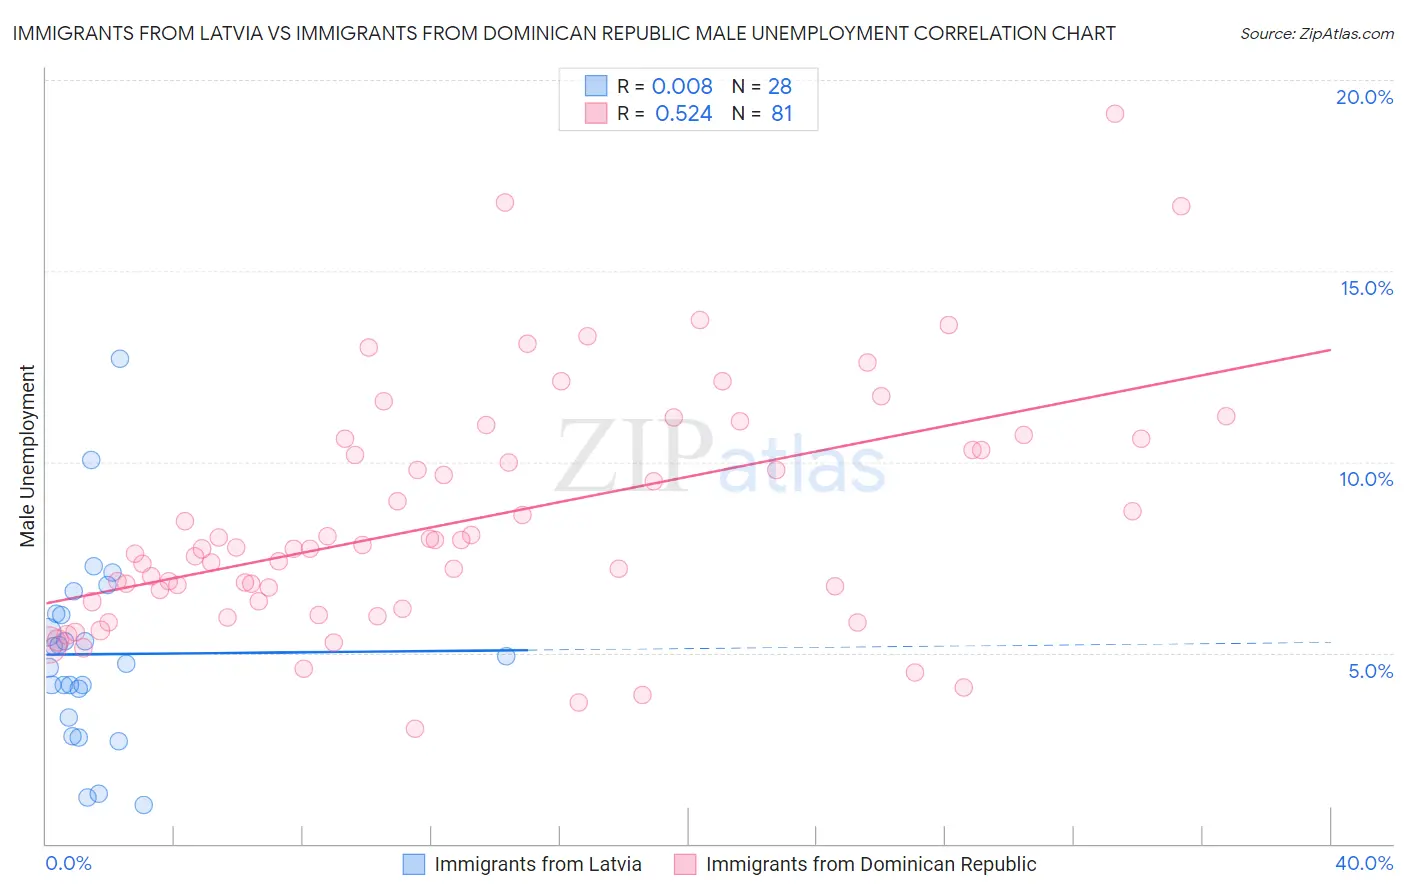
Immigrants from Latvia vs Immigrants from Dominican Republic Male Unemployment Correlation Chart
The statistical analysis conducted on geographies consisting of 113,659,649 people shows no correlation between the proportion of Immigrants from Latvia and unemployment rate among males in the United States with a correlation coefficient (R) of 0.008 and weighted average of 5.1%. Similarly, the statistical analysis conducted on geographies consisting of 274,236,953 people shows a substantial positive correlation between the proportion of Immigrants from Dominican Republic and unemployment rate among males in the United States with a correlation coefficient (R) of 0.524 and weighted average of 7.6%, a difference of 47.9%.
Male Unemployment Correlation Summary
| Measurement | Immigrants from Latvia | Immigrants from Dominican Republic |
| Minimum | 1.0% | 3.0% |
| Maximum | 12.7% | 19.1% |
| Range | 11.7% | 16.1% |
| Mean | 5.0% | 8.5% |
| Median | 4.8% | 7.7% |
| Interquartile 25% (IQ1) | 3.7% | 6.3% |
| Interquartile 75% (IQ3) | 6.0% | 10.5% |
| Interquartile Range (IQR) | 2.3% | 4.1% |
| Standard Deviation (Sample) | 2.5% | 3.1% |
| Standard Deviation (Population) | 2.5% | 3.1% |
Similar Demographics by Male Unemployment
Demographics Similar to Immigrants from Latvia by Male Unemployment
In terms of male unemployment, the demographic groups most similar to Immigrants from Latvia are Palestinian (5.1%, a difference of 0.030%), Immigrants from Lithuania (5.1%, a difference of 0.040%), Nicaraguan (5.1%, a difference of 0.10%), Immigrants from Colombia (5.1%, a difference of 0.10%), and Ukrainian (5.1%, a difference of 0.13%).
| Demographics | Rating | Rank | Male Unemployment |
| Estonians | 89.0 /100 | #117 | Excellent 5.1% |
| Cypriots | 88.8 /100 | #118 | Excellent 5.1% |
| French Canadians | 88.6 /100 | #119 | Excellent 5.1% |
| Ukrainians | 88.4 /100 | #120 | Excellent 5.1% |
| Mongolians | 88.4 /100 | #121 | Excellent 5.1% |
| Nicaraguans | 88.2 /100 | #122 | Excellent 5.1% |
| Palestinians | 87.7 /100 | #123 | Excellent 5.1% |
| Immigrants | Latvia | 87.5 /100 | #124 | Excellent 5.1% |
| Immigrants | Lithuania | 87.2 /100 | #125 | Excellent 5.1% |
| Immigrants | Colombia | 86.8 /100 | #126 | Excellent 5.1% |
| Immigrants | Brazil | 86.3 /100 | #127 | Excellent 5.2% |
| Hungarians | 85.1 /100 | #128 | Excellent 5.2% |
| Immigrants | Western Europe | 84.8 /100 | #129 | Excellent 5.2% |
| Immigrants | Malaysia | 83.5 /100 | #130 | Excellent 5.2% |
| Immigrants | Germany | 83.0 /100 | #131 | Excellent 5.2% |
Demographics Similar to Immigrants from Dominican Republic by Male Unemployment
In terms of male unemployment, the demographic groups most similar to Immigrants from Dominican Republic are Shoshone (7.6%, a difference of 0.10%), Dominican (7.6%, a difference of 0.48%), Immigrants from Grenada (7.6%, a difference of 0.75%), Paiute (7.7%, a difference of 1.1%), and Native/Alaskan (7.7%, a difference of 1.5%).
| Demographics | Rating | Rank | Male Unemployment |
| British West Indians | 0.0 /100 | #319 | Tragic 7.3% |
| Colville | 0.0 /100 | #320 | Tragic 7.4% |
| Immigrants | St. Vincent and the Grenadines | 0.0 /100 | #321 | Tragic 7.5% |
| Immigrants | Cabo Verde | 0.0 /100 | #322 | Tragic 7.5% |
| Immigrants | Grenada | 0.0 /100 | #323 | Tragic 7.6% |
| Dominicans | 0.0 /100 | #324 | Tragic 7.6% |
| Shoshone | 0.0 /100 | #325 | Tragic 7.6% |
| Immigrants | Dominican Republic | 0.0 /100 | #326 | Tragic 7.6% |
| Paiute | 0.0 /100 | #327 | Tragic 7.7% |
| Natives/Alaskans | 0.0 /100 | #328 | Tragic 7.7% |
| Immigrants | Yemen | 0.0 /100 | #329 | Tragic 7.8% |
| Yakama | 0.0 /100 | #330 | Tragic 7.9% |
| Alaska Natives | 0.0 /100 | #331 | Tragic 8.1% |
| Pima | 0.0 /100 | #332 | Tragic 8.3% |
| Sioux | 0.0 /100 | #333 | Tragic 8.4% |