Immigrants from Latin America vs Shoshone Unemployment Among Women with Children Under 18 years
COMPARE
Immigrants from Latin America
Shoshone
Unemployment Among Women with Children Under 18 years
Unemployment Among Women with Children Under 18 years Comparison
Immigrants from Latin America
Shoshone
6.4%
UNEMPLOYMENT AMONG WOMEN WITH CHILDREN UNDER 18 YEARS
0.0/ 100
METRIC RATING
298th/ 347
METRIC RANK
6.6%
UNEMPLOYMENT AMONG WOMEN WITH CHILDREN UNDER 18 YEARS
0.0/ 100
METRIC RATING
317th/ 347
METRIC RANK
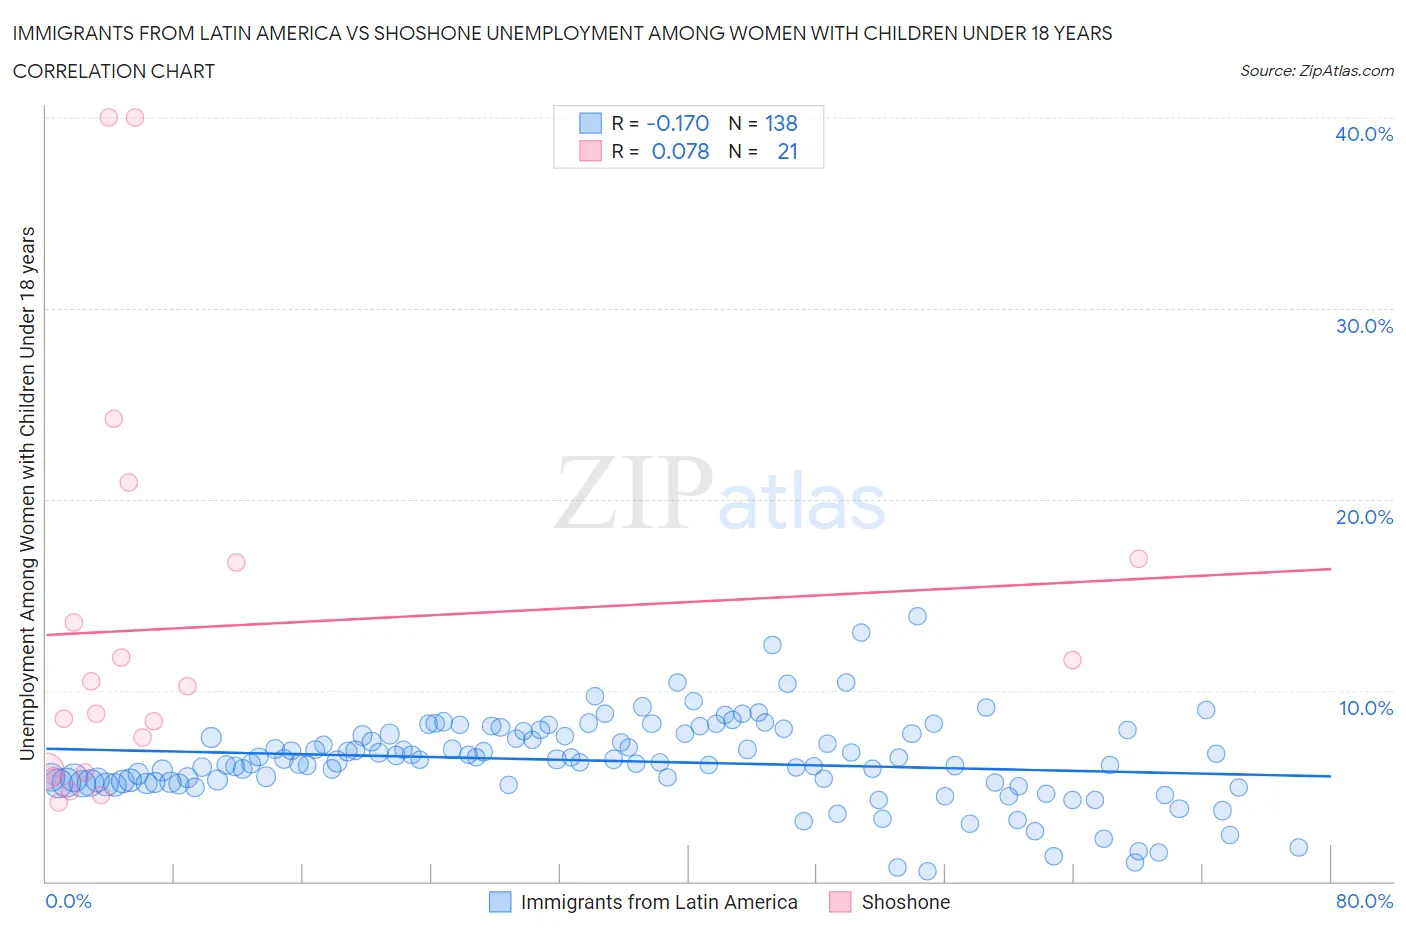
Immigrants from Latin America vs Shoshone Unemployment Among Women with Children Under 18 years Correlation Chart
The statistical analysis conducted on geographies consisting of 512,014,396 people shows a poor negative correlation between the proportion of Immigrants from Latin America and unemployment rate among women with children under the age of 18 in the United States with a correlation coefficient (R) of -0.170 and weighted average of 6.4%. Similarly, the statistical analysis conducted on geographies consisting of 65,640,123 people shows a slight positive correlation between the proportion of Shoshone and unemployment rate among women with children under the age of 18 in the United States with a correlation coefficient (R) of 0.078 and weighted average of 6.6%, a difference of 3.6%.
Unemployment Among Women with Children Under 18 years Correlation Summary
| Measurement | Immigrants from Latin America | Shoshone |
| Minimum | 0.50% | 4.1% |
| Maximum | 13.9% | 40.0% |
| Range | 13.4% | 35.9% |
| Mean | 6.3% | 13.3% |
| Median | 6.3% | 10.2% |
| Interquartile 25% (IQ1) | 5.1% | 5.7% |
| Interquartile 75% (IQ3) | 7.7% | 16.8% |
| Interquartile Range (IQR) | 2.6% | 11.1% |
| Standard Deviation (Sample) | 2.2% | 10.4% |
| Standard Deviation (Population) | 2.2% | 10.1% |
Demographics Similar to Immigrants from Latin America and Shoshone by Unemployment Among Women with Children Under 18 years
In terms of unemployment among women with children under 18 years, the demographic groups most similar to Immigrants from Latin America are Immigrants from Senegal (6.4%, a difference of 0.25%), Jamaican (6.4%, a difference of 0.30%), Immigrants from Jamaica (6.4%, a difference of 0.43%), Immigrants from Haiti (6.4%, a difference of 0.48%), and Immigrants from Armenia (6.5%, a difference of 0.74%). Similarly, the demographic groups most similar to Shoshone are Immigrants from Ecuador (6.6%, a difference of 0.040%), British West Indian (6.6%, a difference of 0.38%), Immigrants from West Indies (6.6%, a difference of 0.38%), Hispanic or Latino (6.6%, a difference of 0.52%), and Immigrants from Mexico (6.6%, a difference of 0.81%).
| Demographics | Rating | Rank | Unemployment Among Women with Children Under 18 years |
| Immigrants | Senegal | 0.0 /100 | #297 | Tragic 6.4% |
| Immigrants | Latin America | 0.0 /100 | #298 | Tragic 6.4% |
| Jamaicans | 0.0 /100 | #299 | Tragic 6.4% |
| Immigrants | Jamaica | 0.0 /100 | #300 | Tragic 6.4% |
| Immigrants | Haiti | 0.0 /100 | #301 | Tragic 6.4% |
| Immigrants | Armenia | 0.0 /100 | #302 | Tragic 6.5% |
| Immigrants | Honduras | 0.0 /100 | #303 | Tragic 6.5% |
| Vietnamese | 0.0 /100 | #304 | Tragic 6.5% |
| Immigrants | Central America | 0.0 /100 | #305 | Tragic 6.5% |
| Immigrants | Guyana | 0.0 /100 | #306 | Tragic 6.5% |
| Belizeans | 0.0 /100 | #307 | Tragic 6.5% |
| Africans | 0.0 /100 | #308 | Tragic 6.5% |
| Ecuadorians | 0.0 /100 | #309 | Tragic 6.5% |
| Guyanese | 0.0 /100 | #310 | Tragic 6.6% |
| Yaqui | 0.0 /100 | #311 | Tragic 6.6% |
| Immigrants | Mexico | 0.0 /100 | #312 | Tragic 6.6% |
| Hispanics or Latinos | 0.0 /100 | #313 | Tragic 6.6% |
| British West Indians | 0.0 /100 | #314 | Tragic 6.6% |
| Immigrants | West Indies | 0.0 /100 | #315 | Tragic 6.6% |
| Immigrants | Ecuador | 0.0 /100 | #316 | Tragic 6.6% |
| Shoshone | 0.0 /100 | #317 | Tragic 6.6% |