Immigrants from Latin America vs Pima Unemployment
COMPARE
Immigrants from Latin America
Pima
Unemployment
Unemployment Comparison
Immigrants from Latin America
Pima
5.9%
UNEMPLOYMENT
0.0/ 100
METRIC RATING
275th/ 347
METRIC RANK
8.2%
UNEMPLOYMENT
0.0/ 100
METRIC RATING
338th/ 347
METRIC RANK
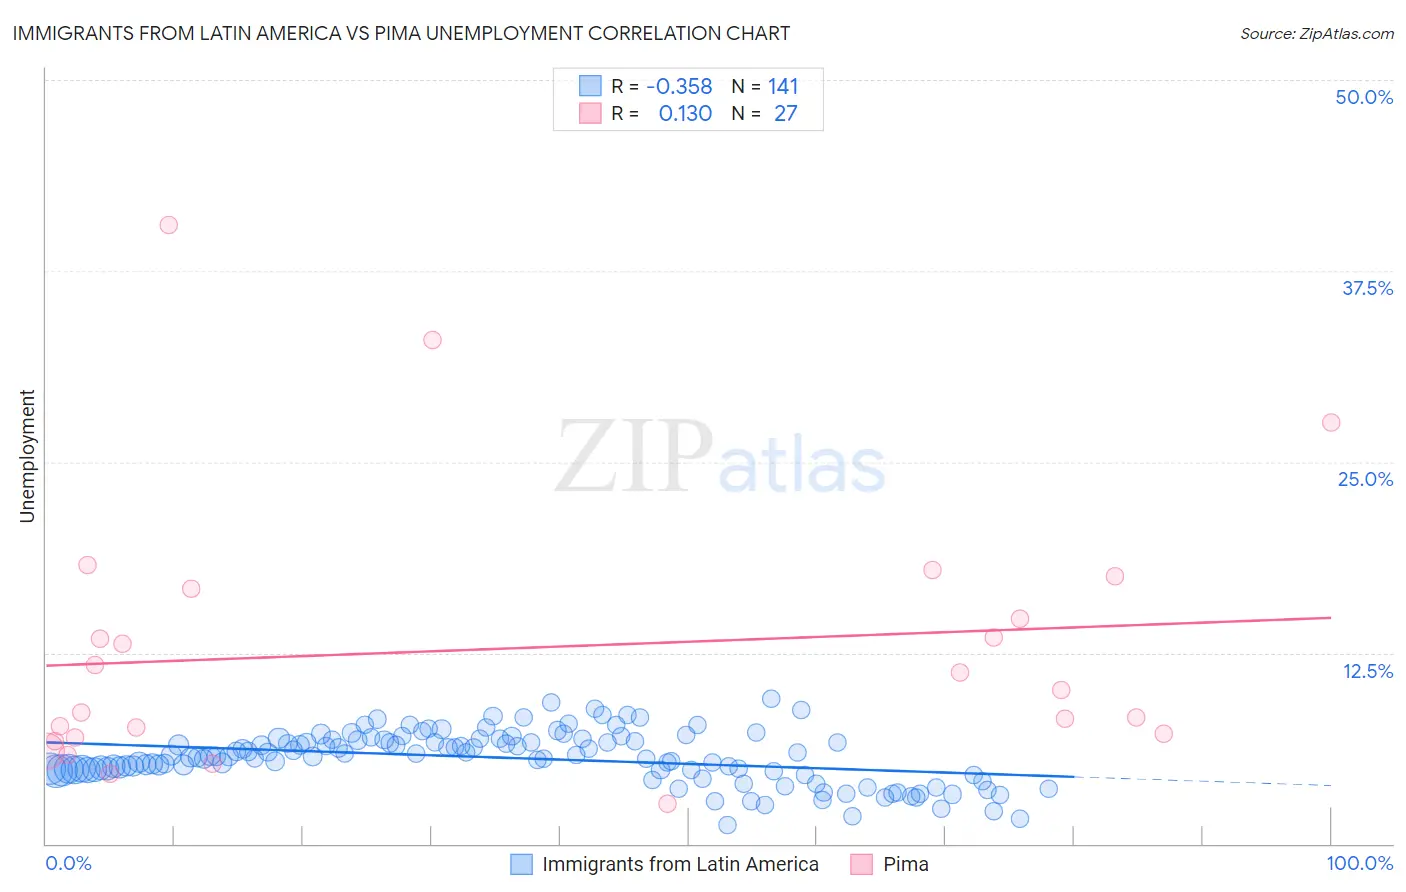
Immigrants from Latin America vs Pima Unemployment Correlation Chart
The statistical analysis conducted on geographies consisting of 555,896,337 people shows a mild negative correlation between the proportion of Immigrants from Latin America and unemployment in the United States with a correlation coefficient (R) of -0.358 and weighted average of 5.9%. Similarly, the statistical analysis conducted on geographies consisting of 61,529,497 people shows a poor positive correlation between the proportion of Pima and unemployment in the United States with a correlation coefficient (R) of 0.130 and weighted average of 8.2%, a difference of 38.5%.
Unemployment Correlation Summary
| Measurement | Immigrants from Latin America | Pima |
| Minimum | 1.2% | 2.6% |
| Maximum | 9.5% | 40.5% |
| Range | 8.3% | 37.9% |
| Mean | 5.6% | 12.8% |
| Median | 5.7% | 10.1% |
| Interquartile 25% (IQ1) | 4.8% | 6.9% |
| Interquartile 75% (IQ3) | 6.8% | 16.7% |
| Interquartile Range (IQR) | 2.0% | 9.8% |
| Standard Deviation (Sample) | 1.7% | 8.9% |
| Standard Deviation (Population) | 1.7% | 8.7% |
Similar Demographics by Unemployment
Demographics Similar to Immigrants from Latin America by Unemployment
In terms of unemployment, the demographic groups most similar to Immigrants from Latin America are Bahamian (5.9%, a difference of 0.21%), Immigrants from Central America (6.0%, a difference of 0.28%), Immigrants from Fiji (5.9%, a difference of 0.50%), Armenian (6.0%, a difference of 0.63%), and Hispanic or Latino (5.9%, a difference of 0.67%).
| Demographics | Rating | Rank | Unemployment |
| Immigrants | Sierra Leone | 0.1 /100 | #268 | Tragic 5.8% |
| Immigrants | El Salvador | 0.1 /100 | #269 | Tragic 5.8% |
| Blackfeet | 0.1 /100 | #270 | Tragic 5.8% |
| Mexicans | 0.1 /100 | #271 | Tragic 5.9% |
| Hispanics or Latinos | 0.0 /100 | #272 | Tragic 5.9% |
| Immigrants | Fiji | 0.0 /100 | #273 | Tragic 5.9% |
| Bahamians | 0.0 /100 | #274 | Tragic 5.9% |
| Immigrants | Latin America | 0.0 /100 | #275 | Tragic 5.9% |
| Immigrants | Central America | 0.0 /100 | #276 | Tragic 6.0% |
| Armenians | 0.0 /100 | #277 | Tragic 6.0% |
| Ghanaians | 0.0 /100 | #278 | Tragic 6.0% |
| Immigrants | Mexico | 0.0 /100 | #279 | Tragic 6.0% |
| Immigrants | Western Africa | 0.0 /100 | #280 | Tragic 6.0% |
| Africans | 0.0 /100 | #281 | Tragic 6.1% |
| Immigrants | Azores | 0.0 /100 | #282 | Tragic 6.1% |
Demographics Similar to Pima by Unemployment
In terms of unemployment, the demographic groups most similar to Pima are Navajo (8.4%, a difference of 1.6%), Puerto Rican (8.4%, a difference of 2.4%), Cheyenne (8.0%, a difference of 2.8%), Immigrants from Yemen (7.7%, a difference of 6.7%), and Alaskan Athabascan (7.7%, a difference of 7.5%).
| Demographics | Rating | Rank | Unemployment |
| Dominicans | 0.0 /100 | #331 | Tragic 7.4% |
| Sioux | 0.0 /100 | #332 | Tragic 7.4% |
| Immigrants | Dominican Republic | 0.0 /100 | #333 | Tragic 7.4% |
| Apache | 0.0 /100 | #334 | Tragic 7.4% |
| Alaskan Athabascans | 0.0 /100 | #335 | Tragic 7.7% |
| Immigrants | Yemen | 0.0 /100 | #336 | Tragic 7.7% |
| Cheyenne | 0.0 /100 | #337 | Tragic 8.0% |
| Pima | 0.0 /100 | #338 | Tragic 8.2% |
| Navajo | 0.0 /100 | #339 | Tragic 8.4% |
| Puerto Ricans | 0.0 /100 | #340 | Tragic 8.4% |
| Tohono O'odham | 0.0 /100 | #341 | Tragic 8.9% |
| Hopi | 0.0 /100 | #342 | Tragic 8.9% |
| Yuman | 0.0 /100 | #343 | Tragic 9.1% |
| Arapaho | 0.0 /100 | #344 | Tragic 9.8% |
| Inupiat | 0.0 /100 | #345 | Tragic 10.1% |