Immigrants from Latin America vs Alaskan Athabascan Unemployment Among Ages 60 to 64 years

COMPARE

Immigrants from Latin America
Race
Ancestry
AfghanAfricanAlaska NativeAlbanianAleutAlsatianAmericanApacheArabArapahoArgentineanArmenianAssyrian/Chaldean/SyriacAustralianAustrianBahamianBangladeshiBarbadianBasqueBelgianBelizeanBermudanBhutaneseBlackfeetBolivianBrazilianBritishBritish West IndianBulgarianBurmeseCajunCambodianCanadianCape VerdeanCarpatho RusynCelticCentral AmericanCentral American IndianCherokeeCheyenneChickasawChileanChineseChippewaChoctawColombianColvilleComancheCosta RicanCreeCreekCroatianCrowCubanCypriotCzechCzechoslovakianDanishDelawareDominicanDutchDutch West IndianEastern EuropeanEcuadorianEgyptianEnglishEstonianEthiopianEuropeanFijianFilipinoFinnishFrenchFrench American IndianFrench CanadianGermanGerman RussianGhanaianGreekGuamanian/ChamorroGuatemalanGuyaneseHaitianHmongHonduranHopiHoumaHungarianIcelanderIndian (Asian)IndonesianInupiatIranianIraqiIrishIroquoisIsraeliItalianJamaicanJapaneseJordanianKenyanKiowaKoreanLaotianLatvianLebaneseLiberianLithuanianLumbeeLuxembourgerMacedonianMalaysianMalteseMarshalleseMenomineeMexicanMexican American IndianMongolianMoroccanNative HawaiianNavajoNepaleseNew ZealanderNicaraguanNigerianNorthern EuropeanNorwegianOkinawanOsageOttawaPaiutePakistaniPalestinianPanamanianParaguayanPennsylvania GermanPeruvianPimaPolishPortuguesePotawatomiPuebloPuerto RicanPuget Sound SalishRomanianRussianSalvadoranSamoanScandinavianScotch-IrishScottishSeminoleSenegaleseSerbianShoshoneSierra LeoneanSiouxSlavicSlovakSloveneSomaliSouth AfricanSouth AmericanSouth American IndianSoviet UnionSpaniardSpanishSpanish AmericanSpanish American IndianSri LankanSubsaharan AfricanSudaneseSwedishSwissSyrianTaiwaneseThaiTlingit-HaidaTohono O'OdhamTonganTrinidadian and TobagonianTsimshianTurkishU.S. Virgin IslanderUgandanUkrainianUruguayanUteVenezuelanVietnameseWelshWest IndianYakamaYaquiYugoslavianYumanYup'ikZimbabwean
Immigration
NonimmigrantsImmigrantsAfghanistanAfricaAlbaniaArgentinaArmeniaAsiaAustraliaAustriaBahamasBangladeshBarbadosBelarusBelgiumBelizeBoliviaBosnia and HerzegovinaBrazilBulgariaBurma/MyanmarCabo VerdeCambodiaCameroonCanadaCaribbeanCentral AmericaChileChinaColombiaCongoCosta RicaCroatiaCubaCzechoslovakiaDenmarkDominicaDominican RepublicEastern AfricaEastern AsiaEastern EuropeEcuadorEgyptEl SalvadorEnglandEritreaEthiopiaEuropeFijiFranceGermanyGhanaGreeceGrenadaGuatemalaGuyanaHaitiHondurasHong KongHungaryIndiaIndonesiaIranIraqIrelandIsraelItalyJamaicaJapanJordanKazakhstanKenyaKoreaKuwaitLaosLatin AmericaLatviaLebanonLiberiaLithuaniaMalaysiaMexicoMicronesiaMiddle AfricaMoldovaMoroccoNepalNetherlandsNicaraguaNigeriaNorth AmericaNorth MacedoniaNorthern AfricaNorthern EuropeNorwayOceaniaPakistanPanamaPeruPhilippinesPolandPortugalRomaniaRussiaSaudi ArabiaScotlandSenegalSerbiaSierra LeoneSingaporeSomaliaSouth AfricaSouth AmericaSouth Central AsiaSouth Eastern AsiaSouthern EuropeSpainSri LankaSt. Vincent and the GrenadinesSudanSwedenSwitzerlandSyriaTaiwanThailandTrinidad and TobagoTurkeyUgandaUkraineUruguayUzbekistanVenezuelaVietnamWest IndiesWestern AfricaWestern AsiaWestern EuropeYemenZaireZimbabweAzores
Alaskan Athabascan
Race
Ancestry
AfghanAfricanAlaska NativeAlaskan AthabascanAlbanianAleutAlsatianAmericanApacheArabArapahoArgentineanArmenianAssyrian/Chaldean/SyriacAustralianAustrianBahamianBangladeshiBarbadianBasqueBelgianBelizeanBermudanBhutaneseBlackfeetBolivianBrazilianBritishBritish West IndianBulgarianBurmeseCajunCambodianCanadianCape VerdeanCarpatho RusynCelticCentral AmericanCentral American IndianCherokeeCheyenneChickasawChileanChineseChippewaChoctawColombianColvilleComancheCosta RicanCreeCreekCroatianCrowCubanCypriotCzechCzechoslovakianDanishDelawareDominicanDutchDutch West IndianEastern EuropeanEcuadorianEgyptianEnglishEstonianEthiopianEuropeanFijianFilipinoFinnishFrenchFrench American IndianFrench CanadianGermanGerman RussianGhanaianGreekGuamanian/ChamorroGuatemalanGuyaneseHaitianHmongHonduranHopiHoumaHungarianIcelanderIndian (Asian)IndonesianInupiatIranianIraqiIrishIroquoisIsraeliItalianJamaicanJapaneseJordanianKenyanKiowaKoreanLaotianLatvianLebaneseLiberianLithuanianLumbeeLuxembourgerMacedonianMalaysianMalteseMarshalleseMenomineeMexicanMexican American IndianMongolianMoroccanNative HawaiianNavajoNepaleseNew ZealanderNicaraguanNigerianNorthern EuropeanNorwegianOkinawanOsageOttawaPaiutePakistaniPalestinianPanamanianParaguayanPennsylvania GermanPeruvianPimaPolishPortuguesePotawatomiPuebloPuerto RicanPuget Sound SalishRomanianRussianSalvadoranSamoanScandinavianScotch-IrishScottishSeminoleSenegaleseSerbianShoshoneSierra LeoneanSiouxSlavicSlovakSloveneSomaliSouth AfricanSouth AmericanSouth American IndianSoviet UnionSpaniardSpanishSpanish AmericanSpanish American IndianSri LankanSubsaharan AfricanSudaneseSwedishSwissSyrianTaiwaneseThaiTlingit-HaidaTohono O'OdhamTonganTrinidadian and TobagonianTsimshianTurkishU.S. Virgin IslanderUgandanUkrainianUruguayanUteVenezuelanVietnameseWelshWest IndianYakamaYaquiYugoslavianYumanYup'ikZimbabwean
Immigration
NonimmigrantsImmigrantsAfghanistanAfricaAlbaniaArgentinaArmeniaAsiaAustraliaAustriaBahamasBangladeshBarbadosBelarusBelgiumBelizeBoliviaBosnia and HerzegovinaBrazilBulgariaBurma/MyanmarCabo VerdeCambodiaCameroonCanadaCaribbeanCentral AmericaChileChinaColombiaCongoCosta RicaCroatiaCubaCzechoslovakiaDenmarkDominicaDominican RepublicEastern AfricaEastern AsiaEastern EuropeEcuadorEgyptEl SalvadorEnglandEritreaEthiopiaEuropeFijiFranceGermanyGhanaGreeceGrenadaGuatemalaGuyanaHaitiHondurasHong KongHungaryIndiaIndonesiaIranIraqIrelandIsraelItalyJamaicaJapanJordanKazakhstanKenyaKoreaKuwaitLaosLatviaLebanonLiberiaLithuaniaMalaysiaMexicoMicronesiaMiddle AfricaMoldovaMoroccoNepalNetherlandsNicaraguaNigeriaNorth AmericaNorth MacedoniaNorthern AfricaNorthern EuropeNorwayOceaniaPakistanPanamaPeruPhilippinesPolandPortugalRomaniaRussiaSaudi ArabiaScotlandSenegalSerbiaSierra LeoneSingaporeSomaliaSouth AfricaSouth AmericaSouth Central AsiaSouth Eastern AsiaSouthern EuropeSpainSri LankaSt. Vincent and the GrenadinesSudanSwedenSwitzerlandSyriaTaiwanThailandTrinidad and TobagoTurkeyUgandaUkraineUruguayUzbekistanVenezuelaVietnamWest IndiesWestern AfricaWestern AsiaWestern EuropeYemenZaireZimbabweAzores
Unemployment Among Ages 60 to 64 years
Income
Poverty
Unemployment
Labor Participation
Family Structure
Vehicle Availability
Education Level
Disability

Unemployment Among Ages 60 to 64 years Comparison

Immigrants from Latin America

Alaskan Athabascans

Tragic
Tragic
5.3%
UNEMPLOYMENT AMONG AGES 60 TO 64 YEARS
0.0/ 100
METRIC RATING
292nd/ 347
METRIC RANK
8.4%
UNEMPLOYMENT AMONG AGES 60 TO 64 YEARS
0.0/ 100
METRIC RATING
345th/ 347
METRIC RANK

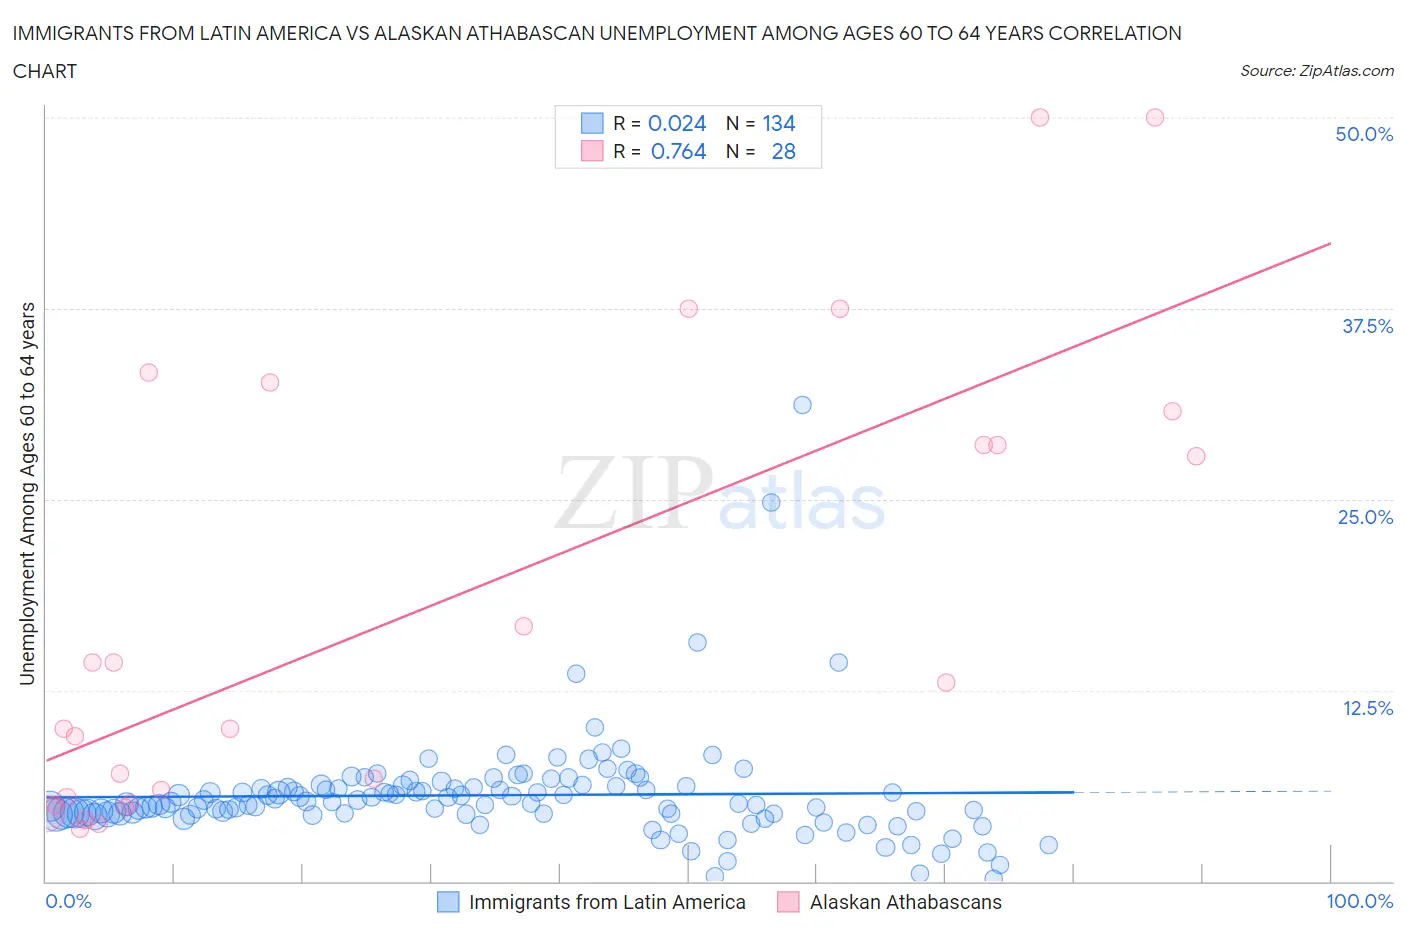
Immigrants from Latin America vs Alaskan Athabascan Unemployment Among Ages 60 to 64 years Correlation Chart

The statistical analysis conducted on geographies consisting of 463,373,177 people shows no correlation between the proportion of Immigrants from Latin America and unemployment rate among population between the ages 60 and 64 in the United States with a correlation coefficient (R) of 0.024 and weighted average of 5.3%. Similarly, the statistical analysis conducted on geographies consisting of 44,056,106 people shows a strong positive correlation between the proportion of Alaskan Athabascans and unemployment rate among population between the ages 60 and 64 in the United States with a correlation coefficient (R) of 0.764 and weighted average of 8.4%, a difference of 57.9%.
Immigrants from Latin America vs Alaskan Athabascan Unemployment Among Ages 60 to 64 years

Unemployment Among Ages 60 to 64 years Correlation Summary

MeasurementImmigrants from Latin AmericaAlaskan Athabascan
Minimum0.20%3.4%
Maximum31.2%50.0%
Range31.0%46.6%
Mean5.6%17.9%
Median5.1%11.5%
Interquartile 25% (IQ1)4.4%5.3%
Interquartile 75% (IQ3)6.1%29.7%
Interquartile Range (IQR)1.7%24.4%
Standard Deviation (Sample)3.5%14.7%
Standard Deviation (Population)3.5%14.5%

Similar Demographics by Unemployment Among Ages 60 to 64 years

Demographics Similar to Immigrants from Latin America by Unemployment Among Ages 60 to 64 years

In terms of unemployment among ages 60 to 64 years, the demographic groups most similar to Immigrants from Latin America are Hispanic or Latino (5.3%, a difference of 0.020%), Immigrants from Israel (5.3%, a difference of 0.020%), Black/African American (5.3%, a difference of 0.13%), Armenian (5.3%, a difference of 0.16%), and Jamaican (5.3%, a difference of 0.28%).
DemographicsRating | RankUnemployment Among Ages 60 to 64 years
West Indians
0.0
/100
|
#285
Tragic
5.3%
Mexican American Indians
0.0
/100
|
#286
Tragic
5.3%
Salvadorans
0.0
/100
|
#287
Tragic
5.3%
Trinidadians and Tobagonians
0.0
/100
|
#288
Tragic
5.3%
Spanish Americans
0.0
/100
|
#289
Tragic
5.3%
Immigrants | Trinidad and Tobago
0.0
/100
|
#290
Tragic
5.3%
Hispanics or Latinos
0.0
/100
|
#291
Tragic
5.3%
Immigrants | Latin America
0.0
/100
|
#292
Tragic
5.3%
Immigrants | Israel
0.0
/100
|
#293
Tragic
5.3%
Blacks/African Americans
0.0
/100
|
#294
Tragic
5.3%
Armenians
0.0
/100
|
#295
Tragic
5.3%
Jamaicans
0.0
/100
|
#296
Tragic
5.3%
Osage
0.0
/100
|
#297
Tragic
5.4%
Immigrants | Central America
0.0
/100
|
#298
Tragic
5.4%
Immigrants | El Salvador
0.0
/100
|
#299
Tragic
5.4%

Demographics Similar to Alaskan Athabascans by Unemployment Among Ages 60 to 64 years

In terms of unemployment among ages 60 to 64 years, the demographic groups most similar to Alaskan Athabascans are Alaska Native (7.6%, a difference of 10.0%), Inupiat (9.6%, a difference of 14.2%), Immigrants from Yemen (6.8%, a difference of 22.9%), Aleut (6.8%, a difference of 23.8%), and Yuman (6.8%, a difference of 23.8%).
DemographicsRating | RankUnemployment Among Ages 60 to 64 years
Immigrants | Dominican Republic
0.0
/100
|
#333
Tragic
6.0%
Puerto Ricans
0.0
/100
|
#334
Tragic
6.1%
Vietnamese
0.0
/100
|
#335
Tragic
6.1%
Kiowa
0.0
/100
|
#336
Tragic
6.2%
Navajo
0.0
/100
|
#337
Tragic
6.3%
Arapaho
0.0
/100
|
#338
Tragic
6.3%
Tlingit-Haida
0.0
/100
|
#339
Tragic
6.4%
Pueblo
0.0
/100
|
#340
Tragic
6.7%
Yuman
0.0
/100
|
#341
Tragic
6.8%
Aleuts
0.0
/100
|
#342
Tragic
6.8%
Immigrants | Yemen
0.0
/100
|
#343
Tragic
6.8%
Alaska Natives
0.0
/100
|
#344
Tragic
7.6%
Alaskan Athabascans
0.0
/100
|
#345
Tragic
8.4%
Inupiat
0.0
/100
|
#346
Tragic
9.6%
Yup'ik
0.0
/100
|
#347
Tragic
11.9%