Immigrants from Latin America vs Afghan Unemployment Among Ages 35 to 44 years

COMPARE

Immigrants from Latin America
Race
Ancestry
AfricanAlaska NativeAlaskan AthabascanAlbanianAleutAlsatianAmericanApacheArabArapahoArgentineanArmenianAssyrian/Chaldean/SyriacAustralianAustrianBahamianBangladeshiBarbadianBasqueBelgianBelizeanBermudanBhutaneseBlackfeetBolivianBrazilianBritishBritish West IndianBulgarianBurmeseCajunCambodianCanadianCape VerdeanCarpatho RusynCelticCentral AmericanCentral American IndianCherokeeCheyenneChickasawChileanChineseChippewaChoctawColombianColvilleComancheCosta RicanCreeCreekCroatianCrowCubanCypriotCzechCzechoslovakianDanishDelawareDominicanDutchDutch West IndianEastern EuropeanEcuadorianEgyptianEnglishEstonianEthiopianEuropeanFijianFilipinoFinnishFrenchFrench American IndianFrench CanadianGermanGerman RussianGhanaianGreekGuamanian/ChamorroGuatemalanGuyaneseHaitianHmongHonduranHopiHoumaHungarianIcelanderIndian (Asian)IndonesianInupiatIranianIraqiIrishIroquoisIsraeliItalianJamaicanJapaneseJordanianKenyanKiowaKoreanLaotianLatvianLebaneseLiberianLithuanianLumbeeLuxembourgerMacedonianMalaysianMalteseMarshalleseMenomineeMexicanMexican American IndianMongolianMoroccanNative HawaiianNavajoNepaleseNew ZealanderNicaraguanNigerianNorthern EuropeanNorwegianOkinawanOsageOttawaPaiutePakistaniPalestinianPanamanianParaguayanPennsylvania GermanPeruvianPimaPolishPortuguesePotawatomiPuebloPuerto RicanPuget Sound SalishRomanianRussianSalvadoranSamoanScandinavianScotch-IrishScottishSeminoleSenegaleseSerbianShoshoneSierra LeoneanSiouxSlavicSlovakSloveneSomaliSouth AfricanSouth AmericanSouth American IndianSoviet UnionSpaniardSpanishSpanish AmericanSpanish American IndianSri LankanSubsaharan AfricanSudaneseSwedishSwissSyrianTaiwaneseThaiTlingit-HaidaTohono O'OdhamTonganTrinidadian and TobagonianTsimshianTurkishU.S. Virgin IslanderUgandanUkrainianUruguayanUteVenezuelanVietnameseWelshWest IndianYakamaYaquiYugoslavianYumanYup'ikZimbabwean
Immigration
NonimmigrantsImmigrantsAfghanistanAfricaAlbaniaArgentinaArmeniaAsiaAustraliaAustriaBahamasBangladeshBarbadosBelarusBelgiumBelizeBoliviaBosnia and HerzegovinaBrazilBulgariaBurma/MyanmarCabo VerdeCambodiaCameroonCanadaCaribbeanCentral AmericaChileChinaColombiaCongoCosta RicaCroatiaCubaCzechoslovakiaDenmarkDominicaDominican RepublicEastern AfricaEastern AsiaEastern EuropeEcuadorEgyptEl SalvadorEnglandEritreaEthiopiaEuropeFijiFranceGermanyGhanaGreeceGrenadaGuatemalaGuyanaHaitiHondurasHong KongHungaryIndiaIndonesiaIranIraqIrelandIsraelItalyJamaicaJapanJordanKazakhstanKenyaKoreaKuwaitLaosLatin AmericaLatviaLebanonLiberiaLithuaniaMalaysiaMexicoMicronesiaMiddle AfricaMoldovaMoroccoNepalNetherlandsNicaraguaNigeriaNorth AmericaNorth MacedoniaNorthern AfricaNorthern EuropeNorwayOceaniaPakistanPanamaPeruPhilippinesPolandPortugalRomaniaRussiaSaudi ArabiaScotlandSenegalSerbiaSierra LeoneSingaporeSomaliaSouth AfricaSouth AmericaSouth Central AsiaSouth Eastern AsiaSouthern EuropeSpainSri LankaSt. Vincent and the GrenadinesSudanSwedenSwitzerlandSyriaTaiwanThailandTrinidad and TobagoTurkeyUgandaUkraineUruguayUzbekistanVenezuelaVietnamWest IndiesWestern AfricaWestern AsiaWestern EuropeYemenZaireZimbabweAzores
Afghan
Race
Ancestry
AfghanAfricanAlaska NativeAlaskan AthabascanAlbanianAleutAlsatianAmericanApacheArabArapahoArgentineanArmenianAssyrian/Chaldean/SyriacAustralianAustrianBahamianBangladeshiBarbadianBasqueBelgianBelizeanBermudanBhutaneseBlackfeetBolivianBrazilianBritishBritish West IndianBulgarianBurmeseCajunCambodianCanadianCape VerdeanCarpatho RusynCelticCentral AmericanCentral American IndianCherokeeCheyenneChickasawChileanChineseChippewaChoctawColombianColvilleComancheCosta RicanCreeCreekCroatianCrowCubanCypriotCzechCzechoslovakianDanishDelawareDominicanDutchDutch West IndianEastern EuropeanEcuadorianEgyptianEnglishEstonianEthiopianEuropeanFijianFilipinoFinnishFrenchFrench American IndianFrench CanadianGermanGerman RussianGhanaianGreekGuamanian/ChamorroGuatemalanGuyaneseHaitianHmongHonduranHopiHoumaHungarianIcelanderIndian (Asian)IndonesianInupiatIranianIraqiIrishIroquoisIsraeliItalianJamaicanJapaneseJordanianKenyanKiowaKoreanLaotianLatvianLebaneseLiberianLithuanianLumbeeLuxembourgerMacedonianMalaysianMalteseMarshalleseMenomineeMexicanMexican American IndianMongolianMoroccanNative HawaiianNavajoNepaleseNew ZealanderNicaraguanNigerianNorthern EuropeanNorwegianOkinawanOsageOttawaPaiutePakistaniPalestinianPanamanianParaguayanPennsylvania GermanPeruvianPimaPolishPortuguesePotawatomiPuebloPuerto RicanPuget Sound SalishRomanianRussianSalvadoranSamoanScandinavianScotch-IrishScottishSeminoleSenegaleseSerbianShoshoneSierra LeoneanSiouxSlavicSlovakSloveneSomaliSouth AfricanSouth AmericanSouth American IndianSoviet UnionSpaniardSpanishSpanish AmericanSpanish American IndianSri LankanSubsaharan AfricanSudaneseSwedishSwissSyrianTaiwaneseThaiTlingit-HaidaTohono O'OdhamTonganTrinidadian and TobagonianTsimshianTurkishU.S. Virgin IslanderUgandanUkrainianUruguayanUteVenezuelanVietnameseWelshWest IndianYakamaYaquiYugoslavianYumanYup'ikZimbabwean
Immigration
NonimmigrantsImmigrantsAfghanistanAfricaAlbaniaArgentinaArmeniaAsiaAustraliaAustriaBahamasBangladeshBarbadosBelarusBelgiumBelizeBoliviaBosnia and HerzegovinaBrazilBulgariaBurma/MyanmarCabo VerdeCambodiaCameroonCanadaCaribbeanCentral AmericaChileChinaColombiaCongoCosta RicaCroatiaCubaCzechoslovakiaDenmarkDominicaDominican RepublicEastern AfricaEastern AsiaEastern EuropeEcuadorEgyptEl SalvadorEnglandEritreaEthiopiaEuropeFijiFranceGermanyGhanaGreeceGrenadaGuatemalaGuyanaHaitiHondurasHong KongHungaryIndiaIndonesiaIranIraqIrelandIsraelItalyJamaicaJapanJordanKazakhstanKenyaKoreaKuwaitLaosLatviaLebanonLiberiaLithuaniaMalaysiaMexicoMicronesiaMiddle AfricaMoldovaMoroccoNepalNetherlandsNicaraguaNigeriaNorth AmericaNorth MacedoniaNorthern AfricaNorthern EuropeNorwayOceaniaPakistanPanamaPeruPhilippinesPolandPortugalRomaniaRussiaSaudi ArabiaScotlandSenegalSerbiaSierra LeoneSingaporeSomaliaSouth AfricaSouth AmericaSouth Central AsiaSouth Eastern AsiaSouthern EuropeSpainSri LankaSt. Vincent and the GrenadinesSudanSwedenSwitzerlandSyriaTaiwanThailandTrinidad and TobagoTurkeyUgandaUkraineUruguayUzbekistanVenezuelaVietnamWest IndiesWestern AfricaWestern AsiaWestern EuropeYemenZaireZimbabweAzores
Unemployment Among Ages 35 to 44 years
Income
Poverty
Unemployment
Labor Participation
Family Structure
Vehicle Availability
Education Level
Disability

Unemployment Among Ages 35 to 44 years Comparison

Immigrants from Latin America

Afghans

Tragic
Average
5.3%
UNEMPLOYMENT AMONG AGES 35 TO 44 YEARS
0.1/ 100
METRIC RATING
258th/ 347
METRIC RANK
4.7%
UNEMPLOYMENT AMONG AGES 35 TO 44 YEARS
50.0/ 100
METRIC RATING
174th/ 347
METRIC RANK

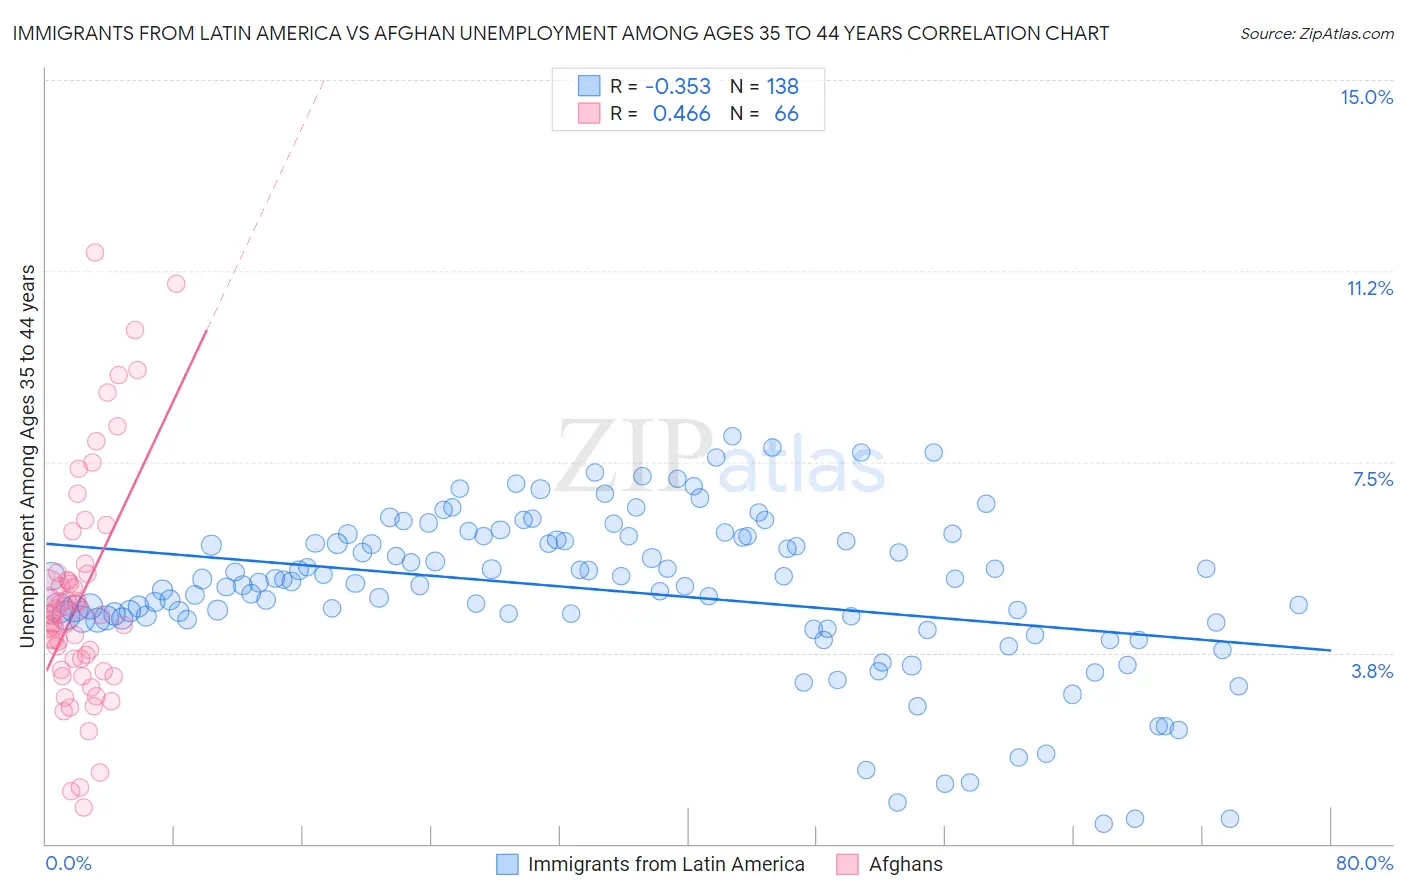
Immigrants from Latin America vs Afghan Unemployment Among Ages 35 to 44 years Correlation Chart

The statistical analysis conducted on geographies consisting of 526,559,283 people shows a mild negative correlation between the proportion of Immigrants from Latin America and unemployment rate among population between the ages 35 and 44 in the United States with a correlation coefficient (R) of -0.353 and weighted average of 5.3%. Similarly, the statistical analysis conducted on geographies consisting of 148,051,072 people shows a moderate positive correlation between the proportion of Afghans and unemployment rate among population between the ages 35 and 44 in the United States with a correlation coefficient (R) of 0.466 and weighted average of 4.7%, a difference of 12.2%.
Immigrants from Latin America vs Afghan Unemployment Among Ages 35 to 44 years

Unemployment Among Ages 35 to 44 years Correlation Summary

MeasurementImmigrants from Latin AmericaAfghan
Minimum0.40%0.70%
Maximum8.0%11.6%
Range7.6%10.9%
Mean5.0%4.8%
Median5.1%4.5%
Interquartile 25% (IQ1)4.4%3.4%
Interquartile 75% (IQ3)6.0%5.3%
Interquartile Range (IQR)1.6%1.9%
Standard Deviation (Sample)1.6%2.2%
Standard Deviation (Population)1.6%2.2%

Similar Demographics by Unemployment Among Ages 35 to 44 years

Demographics Similar to Immigrants from Latin America by Unemployment Among Ages 35 to 44 years

In terms of unemployment among ages 35 to 44 years, the demographic groups most similar to Immigrants from Latin America are Mexican (5.3%, a difference of 0.090%), Immigrants from Fiji (5.3%, a difference of 0.12%), Subsaharan African (5.3%, a difference of 0.13%), Spanish American (5.3%, a difference of 0.33%), and Seminole (5.2%, a difference of 0.41%).
DemographicsRating | RankUnemployment Among Ages 35 to 44 years
Comanche
0.2
/100
|
#251
Tragic
5.2%
Armenians
0.2
/100
|
#252
Tragic
5.2%
Mexican American Indians
0.2
/100
|
#253
Tragic
5.2%
Immigrants | Bahamas
0.2
/100
|
#254
Tragic
5.2%
Cherokee
0.2
/100
|
#255
Tragic
5.2%
Seminole
0.1
/100
|
#256
Tragic
5.2%
Immigrants | Fiji
0.1
/100
|
#257
Tragic
5.3%
Immigrants | Latin America
0.1
/100
|
#258
Tragic
5.3%
Mexicans
0.1
/100
|
#259
Tragic
5.3%
Sub-Saharan Africans
0.1
/100
|
#260
Tragic
5.3%
Spanish Americans
0.1
/100
|
#261
Tragic
5.3%
Immigrants | Central America
0.1
/100
|
#262
Tragic
5.3%
Choctaw
0.1
/100
|
#263
Tragic
5.3%
Ghanaians
0.1
/100
|
#264
Tragic
5.3%
Yaqui
0.1
/100
|
#265
Tragic
5.3%

Demographics Similar to Afghans by Unemployment Among Ages 35 to 44 years

In terms of unemployment among ages 35 to 44 years, the demographic groups most similar to Afghans are Iraqi (4.7%, a difference of 0.060%), Immigrants from Germany (4.7%, a difference of 0.080%), Lebanese (4.7%, a difference of 0.10%), Indonesian (4.7%, a difference of 0.12%), and Immigrants from Uganda (4.7%, a difference of 0.14%).
DemographicsRating | RankUnemployment Among Ages 35 to 44 years
Peruvians
54.4
/100
|
#167
Average
4.7%
Arabs
53.1
/100
|
#168
Average
4.7%
Pennsylvania Germans
53.0
/100
|
#169
Average
4.7%
Immigrants | Indonesia
52.6
/100
|
#170
Average
4.7%
Indonesians
51.7
/100
|
#171
Average
4.7%
Lebanese
51.4
/100
|
#172
Average
4.7%
Iraqis
50.9
/100
|
#173
Average
4.7%
Afghans
50.0
/100
|
#174
Average
4.7%
Immigrants | Germany
48.9
/100
|
#175
Average
4.7%
Immigrants | Uganda
48.1
/100
|
#176
Average
4.7%
Slovaks
44.6
/100
|
#177
Average
4.7%
South American Indians
40.7
/100
|
#178
Average
4.7%
Immigrants | South Eastern Asia
40.2
/100
|
#179
Average
4.7%
Immigrants | Peru
39.9
/100
|
#180
Fair
4.7%
Brazilians
39.5
/100
|
#181
Fair
4.7%