Immigrants from Laos vs Immigrants from Kazakhstan Unemployment Among Ages 35 to 44 years

COMPARE

Immigrants from Laos
Race
Ancestry
AfghanAfricanAlaska NativeAlaskan AthabascanAlbanianAleutAlsatianAmericanApacheArabArapahoArgentineanArmenianAssyrian/Chaldean/SyriacAustralianAustrianBahamianBangladeshiBarbadianBasqueBelgianBelizeanBermudanBhutaneseBlackfeetBolivianBrazilianBritishBritish West IndianBulgarianBurmeseCajunCambodianCanadianCape VerdeanCarpatho RusynCelticCentral AmericanCentral American IndianCherokeeCheyenneChickasawChileanChineseChippewaChoctawColombianColvilleComancheCosta RicanCreeCreekCroatianCrowCubanCypriotCzechCzechoslovakianDanishDelawareDominicanDutchDutch West IndianEastern EuropeanEcuadorianEgyptianEnglishEstonianEthiopianEuropeanFijianFilipinoFinnishFrenchFrench American IndianFrench CanadianGermanGerman RussianGhanaianGreekGuamanian/ChamorroGuatemalanGuyaneseHaitianHmongHonduranHopiHoumaHungarianIcelanderIndian (Asian)IndonesianInupiatIranianIraqiIrishIroquoisIsraeliItalianJamaicanJapaneseJordanianKenyanKiowaKoreanLaotianLatvianLebaneseLiberianLithuanianLumbeeLuxembourgerMacedonianMalaysianMalteseMarshalleseMenomineeMexicanMexican American IndianMongolianMoroccanNative HawaiianNavajoNepaleseNew ZealanderNicaraguanNigerianNorthern EuropeanNorwegianOkinawanOsageOttawaPaiutePakistaniPalestinianPanamanianParaguayanPennsylvania GermanPeruvianPimaPolishPortuguesePotawatomiPuebloPuerto RicanPuget Sound SalishRomanianRussianSalvadoranSamoanScandinavianScotch-IrishScottishSeminoleSenegaleseSerbianShoshoneSierra LeoneanSiouxSlavicSlovakSloveneSomaliSouth AfricanSouth AmericanSouth American IndianSoviet UnionSpaniardSpanishSpanish AmericanSpanish American IndianSri LankanSubsaharan AfricanSudaneseSwedishSwissSyrianTaiwaneseThaiTlingit-HaidaTohono O'OdhamTonganTrinidadian and TobagonianTsimshianTurkishU.S. Virgin IslanderUgandanUkrainianUruguayanUteVenezuelanVietnameseWelshWest IndianYakamaYaquiYugoslavianYumanYup'ikZimbabwean
Immigration
NonimmigrantsImmigrantsAfghanistanAfricaAlbaniaArgentinaArmeniaAsiaAustraliaAustriaBahamasBangladeshBarbadosBelarusBelgiumBelizeBoliviaBosnia and HerzegovinaBrazilBulgariaBurma/MyanmarCabo VerdeCambodiaCameroonCanadaCaribbeanCentral AmericaChileChinaColombiaCongoCosta RicaCroatiaCubaCzechoslovakiaDenmarkDominicaDominican RepublicEastern AfricaEastern AsiaEastern EuropeEcuadorEgyptEl SalvadorEnglandEritreaEthiopiaEuropeFijiFranceGermanyGhanaGreeceGrenadaGuatemalaGuyanaHaitiHondurasHong KongHungaryIndiaIndonesiaIranIraqIrelandIsraelItalyJamaicaJapanJordanKenyaKoreaKuwaitLaosLatin AmericaLatviaLebanonLiberiaLithuaniaMalaysiaMexicoMicronesiaMiddle AfricaMoldovaMoroccoNepalNetherlandsNicaraguaNigeriaNorth AmericaNorth MacedoniaNorthern AfricaNorthern EuropeNorwayOceaniaPakistanPanamaPeruPhilippinesPolandPortugalRomaniaRussiaSaudi ArabiaScotlandSenegalSerbiaSierra LeoneSingaporeSomaliaSouth AfricaSouth AmericaSouth Central AsiaSouth Eastern AsiaSouthern EuropeSpainSri LankaSt. Vincent and the GrenadinesSudanSwedenSwitzerlandSyriaTaiwanThailandTrinidad and TobagoTurkeyUgandaUkraineUruguayUzbekistanVenezuelaVietnamWest IndiesWestern AfricaWestern AsiaWestern EuropeYemenZaireZimbabweAzores
Immigrants from Kazakhstan
Race
Ancestry
AfghanAfricanAlaska NativeAlaskan AthabascanAlbanianAleutAlsatianAmericanApacheArabArapahoArgentineanArmenianAssyrian/Chaldean/SyriacAustralianAustrianBahamianBangladeshiBarbadianBasqueBelgianBelizeanBermudanBhutaneseBlackfeetBolivianBrazilianBritishBritish West IndianBulgarianBurmeseCajunCambodianCanadianCape VerdeanCarpatho RusynCelticCentral AmericanCentral American IndianCherokeeCheyenneChickasawChileanChineseChippewaChoctawColombianColvilleComancheCosta RicanCreeCreekCroatianCrowCubanCypriotCzechCzechoslovakianDanishDelawareDominicanDutchDutch West IndianEastern EuropeanEcuadorianEgyptianEnglishEstonianEthiopianEuropeanFijianFilipinoFinnishFrenchFrench American IndianFrench CanadianGermanGerman RussianGhanaianGreekGuamanian/ChamorroGuatemalanGuyaneseHaitianHmongHonduranHopiHoumaHungarianIcelanderIndian (Asian)IndonesianInupiatIranianIraqiIrishIroquoisIsraeliItalianJamaicanJapaneseJordanianKenyanKiowaKoreanLaotianLatvianLebaneseLiberianLithuanianLumbeeLuxembourgerMacedonianMalaysianMalteseMarshalleseMenomineeMexicanMexican American IndianMongolianMoroccanNative HawaiianNavajoNepaleseNew ZealanderNicaraguanNigerianNorthern EuropeanNorwegianOkinawanOsageOttawaPaiutePakistaniPalestinianPanamanianParaguayanPennsylvania GermanPeruvianPimaPolishPortuguesePotawatomiPuebloPuerto RicanPuget Sound SalishRomanianRussianSalvadoranSamoanScandinavianScotch-IrishScottishSeminoleSenegaleseSerbianShoshoneSierra LeoneanSiouxSlavicSlovakSloveneSomaliSouth AfricanSouth AmericanSouth American IndianSoviet UnionSpaniardSpanishSpanish AmericanSpanish American IndianSri LankanSubsaharan AfricanSudaneseSwedishSwissSyrianTaiwaneseThaiTlingit-HaidaTohono O'OdhamTonganTrinidadian and TobagonianTsimshianTurkishU.S. Virgin IslanderUgandanUkrainianUruguayanUteVenezuelanVietnameseWelshWest IndianYakamaYaquiYugoslavianYumanYup'ikZimbabwean
Immigration
NonimmigrantsImmigrantsAfghanistanAfricaAlbaniaArgentinaArmeniaAsiaAustraliaAustriaBahamasBangladeshBarbadosBelarusBelgiumBelizeBoliviaBosnia and HerzegovinaBrazilBulgariaBurma/MyanmarCabo VerdeCambodiaCameroonCanadaCaribbeanCentral AmericaChileChinaColombiaCongoCosta RicaCroatiaCubaCzechoslovakiaDenmarkDominicaDominican RepublicEastern AfricaEastern AsiaEastern EuropeEcuadorEgyptEl SalvadorEnglandEritreaEthiopiaEuropeFijiFranceGermanyGhanaGreeceGrenadaGuatemalaGuyanaHaitiHondurasHong KongHungaryIndiaIndonesiaIranIraqIrelandIsraelItalyJamaicaJapanJordanKazakhstanKenyaKoreaKuwaitLatin AmericaLatviaLebanonLiberiaLithuaniaMalaysiaMexicoMicronesiaMiddle AfricaMoldovaMoroccoNepalNetherlandsNicaraguaNigeriaNorth AmericaNorth MacedoniaNorthern AfricaNorthern EuropeNorwayOceaniaPakistanPanamaPeruPhilippinesPolandPortugalRomaniaRussiaSaudi ArabiaScotlandSenegalSerbiaSierra LeoneSingaporeSomaliaSouth AfricaSouth AmericaSouth Central AsiaSouth Eastern AsiaSouthern EuropeSpainSri LankaSt. Vincent and the GrenadinesSudanSwedenSwitzerlandSyriaTaiwanThailandTrinidad and TobagoTurkeyUgandaUkraineUruguayUzbekistanVenezuelaVietnamWest IndiesWestern AfricaWestern AsiaWestern EuropeYemenZaireZimbabweAzores
Unemployment Among Ages 35 to 44 years
Income
Poverty
Unemployment
Labor Participation
Family Structure
Vehicle Availability
Education Level
Disability

Unemployment Among Ages 35 to 44 years Comparison

Immigrants from Laos

Immigrants from Kazakhstan

Fair
Excellent
4.7%
UNEMPLOYMENT AMONG AGES 35 TO 44 YEARS
34.5/ 100
METRIC RATING
188th/ 347
METRIC RANK
4.5%
UNEMPLOYMENT AMONG AGES 35 TO 44 YEARS
90.0/ 100
METRIC RATING
110th/ 347
METRIC RANK

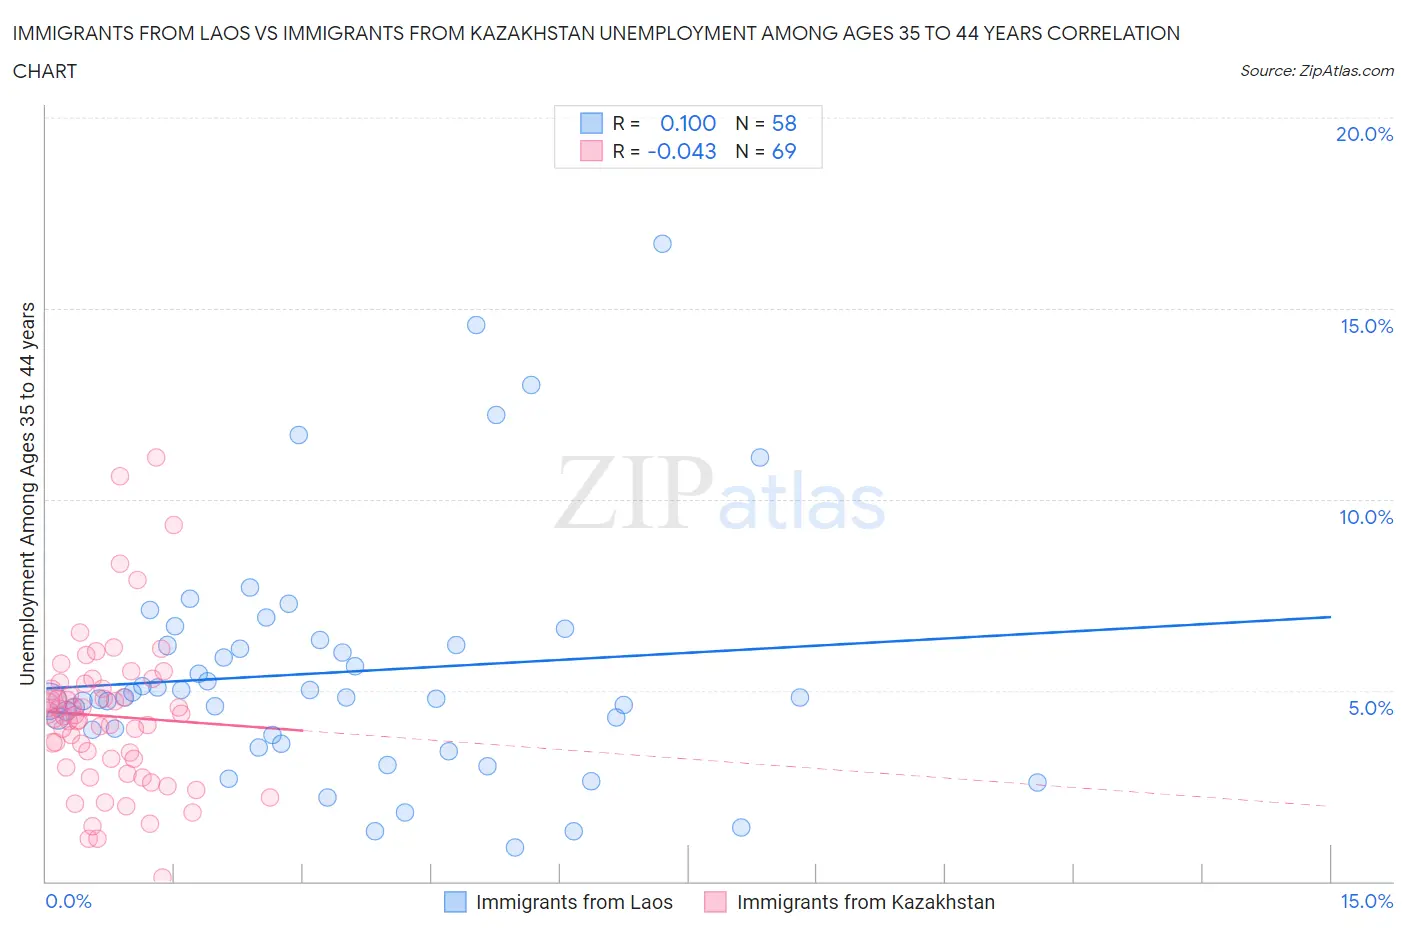
Immigrants from Laos vs Immigrants from Kazakhstan Unemployment Among Ages 35 to 44 years Correlation Chart

The statistical analysis conducted on geographies consisting of 199,441,542 people shows a slight positive correlation between the proportion of Immigrants from Laos and unemployment rate among population between the ages 35 and 44 in the United States with a correlation coefficient (R) of 0.100 and weighted average of 4.7%. Similarly, the statistical analysis conducted on geographies consisting of 123,796,054 people shows no correlation between the proportion of Immigrants from Kazakhstan and unemployment rate among population between the ages 35 and 44 in the United States with a correlation coefficient (R) of -0.043 and weighted average of 4.5%, a difference of 5.2%.
Immigrants from Laos vs Immigrants from Kazakhstan Unemployment Among Ages 35 to 44 years

Unemployment Among Ages 35 to 44 years Correlation Summary

MeasurementImmigrants from LaosImmigrants from Kazakhstan
Minimum0.90%0.10%
Maximum16.7%11.1%
Range15.8%11.0%
Mean5.5%4.3%
Median4.8%4.3%
Interquartile 25% (IQ1)3.8%3.1%
Interquartile 75% (IQ3)6.2%5.1%
Interquartile Range (IQR)2.4%2.0%
Standard Deviation (Sample)3.2%2.0%
Standard Deviation (Population)3.1%2.0%

Similar Demographics by Unemployment Among Ages 35 to 44 years

Demographics Similar to Immigrants from Laos by Unemployment Among Ages 35 to 44 years

In terms of unemployment among ages 35 to 44 years, the demographic groups most similar to Immigrants from Laos are Immigrants from Congo (4.7%, a difference of 0.040%), Immigrants from Southern Europe (4.7%, a difference of 0.050%), Immigrants from South America (4.7%, a difference of 0.050%), Malaysian (4.7%, a difference of 0.080%), and Cypriot (4.7%, a difference of 0.15%).
DemographicsRating | RankUnemployment Among Ages 35 to 44 years
Brazilians
39.5
/100
|
#181
Fair
4.7%
Israelis
38.5
/100
|
#182
Fair
4.7%
Immigrants | Poland
37.9
/100
|
#183
Fair
4.7%
Immigrants | Zaire
37.3
/100
|
#184
Fair
4.7%
Immigrants | Costa Rica
37.0
/100
|
#185
Fair
4.7%
Cypriots
36.5
/100
|
#186
Fair
4.7%
Malaysians
35.5
/100
|
#187
Fair
4.7%
Immigrants | Laos
34.5
/100
|
#188
Fair
4.7%
Immigrants | Congo
33.9
/100
|
#189
Fair
4.7%
Immigrants | Southern Europe
33.8
/100
|
#190
Fair
4.7%
Immigrants | South America
33.8
/100
|
#191
Fair
4.7%
Immigrants | Albania
30.5
/100
|
#192
Fair
4.8%
Spanish
30.4
/100
|
#193
Fair
4.8%
Koreans
28.1
/100
|
#194
Fair
4.8%
Bangladeshis
28.0
/100
|
#195
Fair
4.8%

Demographics Similar to Immigrants from Kazakhstan by Unemployment Among Ages 35 to 44 years

In terms of unemployment among ages 35 to 44 years, the demographic groups most similar to Immigrants from Kazakhstan are Immigrants from Nicaragua (4.5%, a difference of 0.030%), New Zealander (4.5%, a difference of 0.070%), Romanian (4.5%, a difference of 0.070%), Immigrants from North Macedonia (4.5%, a difference of 0.16%), and Immigrants from Czechoslovakia (4.5%, a difference of 0.16%).
DemographicsRating | RankUnemployment Among Ages 35 to 44 years
Welsh
91.6
/100
|
#103
Exceptional
4.5%
Finns
91.6
/100
|
#104
Exceptional
4.5%
Immigrants | Saudi Arabia
91.3
/100
|
#105
Exceptional
4.5%
Immigrants | North America
91.1
/100
|
#106
Exceptional
4.5%
Immigrants | North Macedonia
90.7
/100
|
#107
Exceptional
4.5%
New Zealanders
90.3
/100
|
#108
Exceptional
4.5%
Romanians
90.3
/100
|
#109
Exceptional
4.5%
Immigrants | Kazakhstan
90.0
/100
|
#110
Excellent
4.5%
Immigrants | Nicaragua
89.8
/100
|
#111
Excellent
4.5%
Immigrants | Czechoslovakia
89.2
/100
|
#112
Excellent
4.5%
Immigrants | Italy
88.4
/100
|
#113
Excellent
4.5%
Macedonians
88.3
/100
|
#114
Excellent
4.5%
Maltese
88.1
/100
|
#115
Excellent
4.5%
Immigrants | Israel
88.1
/100
|
#116
Excellent
4.5%
Immigrants | Greece
87.9
/100
|
#117
Excellent
4.5%