Immigrants from Laos vs Cheyenne Unemployment Among Ages 16 to 19 years
COMPARE
Immigrants from Laos
Cheyenne
Unemployment Among Ages 16 to 19 years
Unemployment Among Ages 16 to 19 years Comparison
Immigrants from Laos
Cheyenne
17.1%
UNEMPLOYMENT AMONG AGES 16 TO 19 YEARS
88.8/ 100
METRIC RATING
123rd/ 347
METRIC RANK
22.3%
UNEMPLOYMENT AMONG AGES 16 TO 19 YEARS
0.0/ 100
METRIC RATING
320th/ 347
METRIC RANK
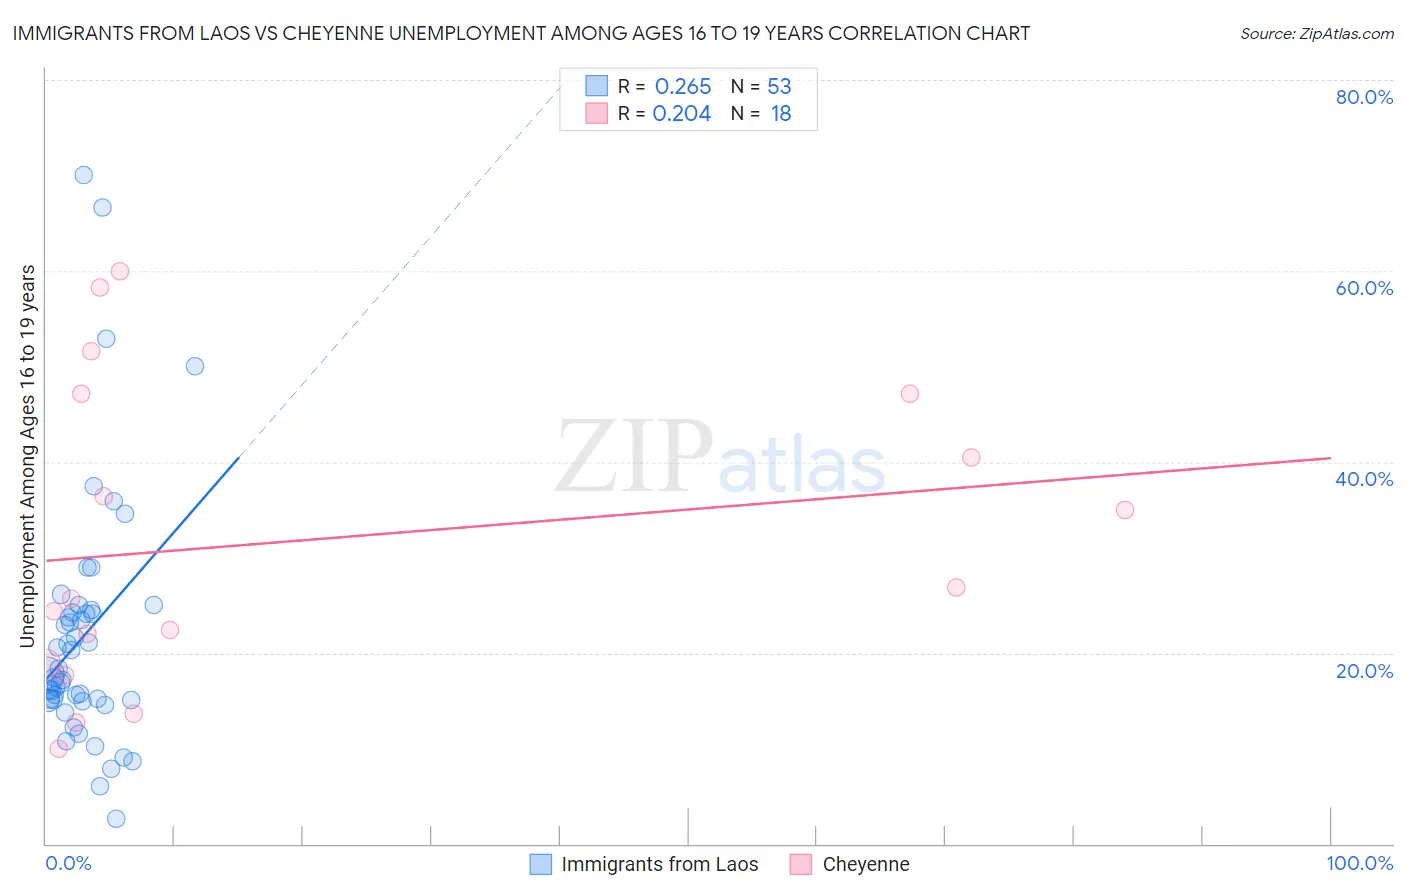
Immigrants from Laos vs Cheyenne Unemployment Among Ages 16 to 19 years Correlation Chart
The statistical analysis conducted on geographies consisting of 196,817,615 people shows a weak positive correlation between the proportion of Immigrants from Laos and unemployment rate among population between the ages 16 and 19 in the United States with a correlation coefficient (R) of 0.265 and weighted average of 17.1%. Similarly, the statistical analysis conducted on geographies consisting of 79,316,787 people shows a weak positive correlation between the proportion of Cheyenne and unemployment rate among population between the ages 16 and 19 in the United States with a correlation coefficient (R) of 0.204 and weighted average of 22.3%, a difference of 29.9%.
Unemployment Among Ages 16 to 19 years Correlation Summary
| Measurement | Immigrants from Laos | Cheyenne |
| Minimum | 2.6% | 9.9% |
| Maximum | 70.0% | 60.0% |
| Range | 67.4% | 50.1% |
| Mean | 21.8% | 31.7% |
| Median | 17.6% | 26.3% |
| Interquartile 25% (IQ1) | 15.0% | 18.9% |
| Interquartile 75% (IQ3) | 24.3% | 47.1% |
| Interquartile Range (IQR) | 9.3% | 28.2% |
| Standard Deviation (Sample) | 13.3% | 15.9% |
| Standard Deviation (Population) | 13.2% | 15.5% |
Similar Demographics by Unemployment Among Ages 16 to 19 years
Demographics Similar to Immigrants from Laos by Unemployment Among Ages 16 to 19 years
In terms of unemployment among ages 16 to 19 years, the demographic groups most similar to Immigrants from Laos are Syrian (17.1%, a difference of 0.020%), Immigrants from Germany (17.2%, a difference of 0.13%), Immigrants from Bolivia (17.2%, a difference of 0.23%), Immigrants from South Eastern Asia (17.1%, a difference of 0.25%), and Immigrants from Moldova (17.1%, a difference of 0.26%).
| Demographics | Rating | Rank | Unemployment Among Ages 16 to 19 years |
| Immigrants | Korea | 92.2 /100 | #116 | Exceptional 17.1% |
| Immigrants | Sri Lanka | 92.0 /100 | #117 | Exceptional 17.1% |
| Venezuelans | 91.8 /100 | #118 | Exceptional 17.1% |
| Hungarians | 91.6 /100 | #119 | Exceptional 17.1% |
| Immigrants | Middle Africa | 90.9 /100 | #120 | Exceptional 17.1% |
| Immigrants | Moldova | 90.7 /100 | #121 | Exceptional 17.1% |
| Immigrants | South Eastern Asia | 90.7 /100 | #122 | Exceptional 17.1% |
| Immigrants | Laos | 88.8 /100 | #123 | Excellent 17.1% |
| Syrians | 88.6 /100 | #124 | Excellent 17.1% |
| Immigrants | Germany | 87.7 /100 | #125 | Excellent 17.2% |
| Immigrants | Bolivia | 86.7 /100 | #126 | Excellent 17.2% |
| Pakistanis | 85.8 /100 | #127 | Excellent 17.2% |
| Australians | 85.6 /100 | #128 | Excellent 17.2% |
| Creek | 85.5 /100 | #129 | Excellent 17.2% |
| Immigrants | Indonesia | 84.7 /100 | #130 | Excellent 17.2% |
Demographics Similar to Cheyenne by Unemployment Among Ages 16 to 19 years
In terms of unemployment among ages 16 to 19 years, the demographic groups most similar to Cheyenne are Immigrants from West Indies (22.2%, a difference of 0.23%), Immigrants from Jamaica (22.2%, a difference of 0.39%), Immigrants from Belize (22.2%, a difference of 0.54%), West Indian (22.4%, a difference of 0.70%), and Barbadian (22.5%, a difference of 0.83%).
| Demographics | Rating | Rank | Unemployment Among Ages 16 to 19 years |
| Jamaicans | 0.0 /100 | #313 | Tragic 21.7% |
| Alaska Natives | 0.0 /100 | #314 | Tragic 21.8% |
| Immigrants | Dominica | 0.0 /100 | #315 | Tragic 21.9% |
| Tohono O'odham | 0.0 /100 | #316 | Tragic 22.1% |
| Immigrants | Belize | 0.0 /100 | #317 | Tragic 22.2% |
| Immigrants | Jamaica | 0.0 /100 | #318 | Tragic 22.2% |
| Immigrants | West Indies | 0.0 /100 | #319 | Tragic 22.2% |
| Cheyenne | 0.0 /100 | #320 | Tragic 22.3% |
| West Indians | 0.0 /100 | #321 | Tragic 22.4% |
| Barbadians | 0.0 /100 | #322 | Tragic 22.5% |
| Yakama | 0.0 /100 | #323 | Tragic 22.5% |
| Immigrants | Armenia | 0.0 /100 | #324 | Tragic 22.6% |
| Trinidadians and Tobagonians | 0.0 /100 | #325 | Tragic 22.6% |
| Immigrants | Trinidad and Tobago | 0.0 /100 | #326 | Tragic 23.1% |
| Pima | 0.0 /100 | #327 | Tragic 23.1% |