Immigrants from Laos vs Apache Male Unemployment
COMPARE
Immigrants from Laos
Apache
Male Unemployment
Male Unemployment Comparison
Immigrants from Laos
Apache
5.4%
MALE UNEMPLOYMENT
13.0/ 100
METRIC RATING
203rd/ 347
METRIC RANK
8.6%
MALE UNEMPLOYMENT
0.0/ 100
METRIC RATING
338th/ 347
METRIC RANK
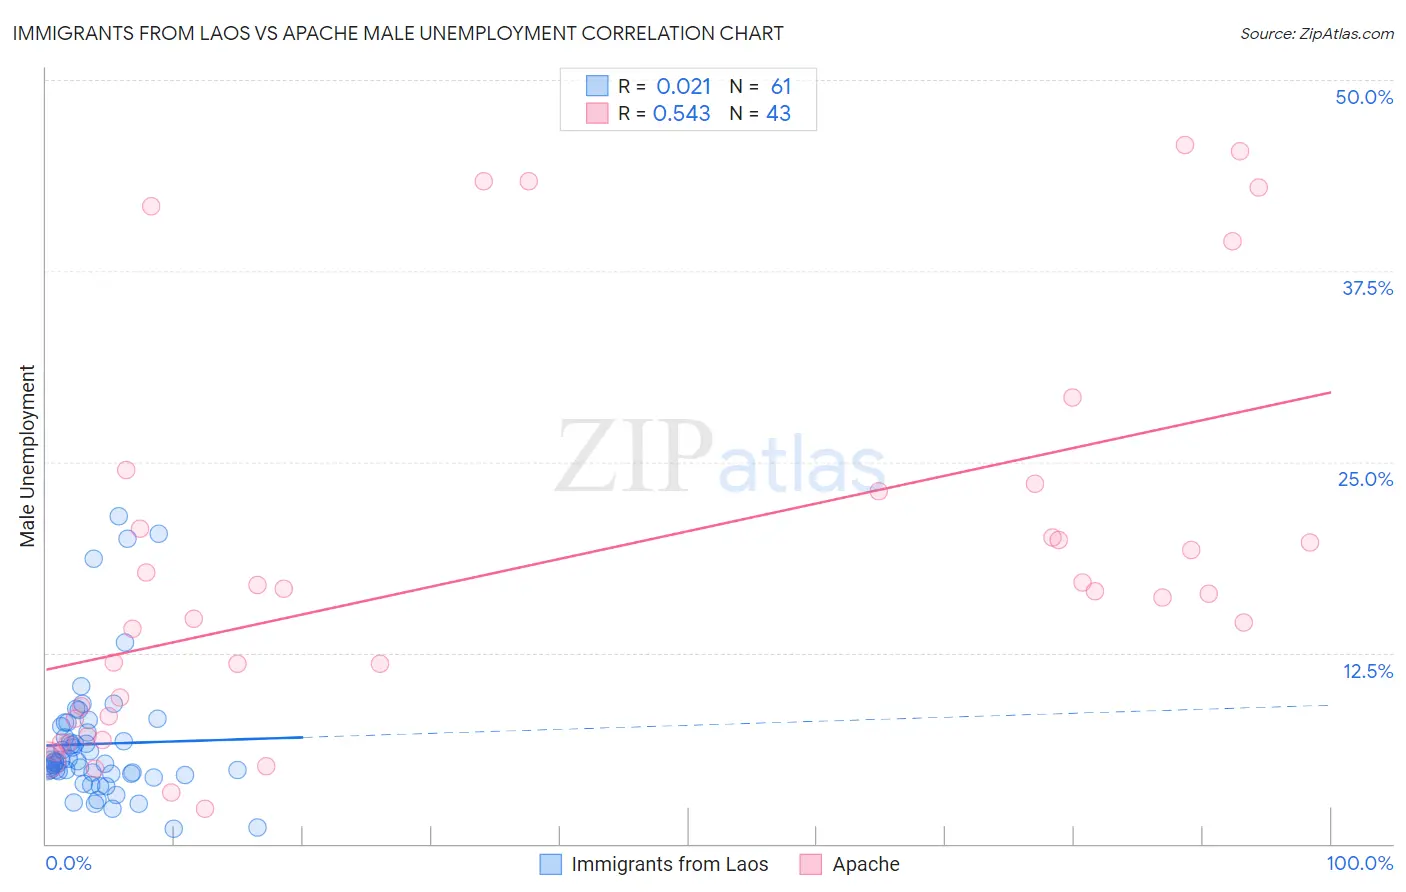
Immigrants from Laos vs Apache Male Unemployment Correlation Chart
The statistical analysis conducted on geographies consisting of 201,122,533 people shows no correlation between the proportion of Immigrants from Laos and unemployment rate among males in the United States with a correlation coefficient (R) of 0.021 and weighted average of 5.4%. Similarly, the statistical analysis conducted on geographies consisting of 230,425,231 people shows a substantial positive correlation between the proportion of Apache and unemployment rate among males in the United States with a correlation coefficient (R) of 0.543 and weighted average of 8.6%, a difference of 58.1%.
Male Unemployment Correlation Summary
| Measurement | Immigrants from Laos | Apache |
| Minimum | 1.0% | 2.3% |
| Maximum | 21.4% | 45.7% |
| Range | 20.4% | 43.4% |
| Mean | 6.5% | 18.3% |
| Median | 5.4% | 16.4% |
| Interquartile 25% (IQ1) | 4.6% | 8.2% |
| Interquartile 75% (IQ3) | 7.5% | 23.1% |
| Interquartile Range (IQR) | 2.9% | 14.9% |
| Standard Deviation (Sample) | 4.2% | 12.7% |
| Standard Deviation (Population) | 4.2% | 12.6% |
Similar Demographics by Male Unemployment
Demographics Similar to Immigrants from Laos by Male Unemployment
In terms of male unemployment, the demographic groups most similar to Immigrants from Laos are Nonimmigrants (5.4%, a difference of 0.010%), Immigrants from Philippines (5.4%, a difference of 0.050%), Immigrants from Zaire (5.4%, a difference of 0.080%), Guamanian/Chamorro (5.4%, a difference of 0.090%), and Immigrants from Greece (5.4%, a difference of 0.18%).
| Demographics | Rating | Rank | Male Unemployment |
| Albanians | 17.3 /100 | #196 | Poor 5.4% |
| Alsatians | 16.7 /100 | #197 | Poor 5.4% |
| Immigrants | Thailand | 14.7 /100 | #198 | Poor 5.4% |
| Immigrants | Greece | 14.5 /100 | #199 | Poor 5.4% |
| Immigrants | Zaire | 13.7 /100 | #200 | Poor 5.4% |
| Immigrants | Philippines | 13.5 /100 | #201 | Poor 5.4% |
| Immigrants | Nonimmigrants | 13.1 /100 | #202 | Poor 5.4% |
| Immigrants | Laos | 13.0 /100 | #203 | Poor 5.4% |
| Guamanians/Chamorros | 12.3 /100 | #204 | Poor 5.4% |
| Immigrants | Costa Rica | 11.4 /100 | #205 | Poor 5.5% |
| Immigrants | Ukraine | 9.9 /100 | #206 | Tragic 5.5% |
| Immigrants | Syria | 9.3 /100 | #207 | Tragic 5.5% |
| Immigrants | Lebanon | 8.6 /100 | #208 | Tragic 5.5% |
| Immigrants | Middle Africa | 8.3 /100 | #209 | Tragic 5.5% |
| South American Indians | 7.6 /100 | #210 | Tragic 5.5% |
Demographics Similar to Apache by Male Unemployment
In terms of male unemployment, the demographic groups most similar to Apache are Puerto Rican (8.6%, a difference of 0.15%), Yuman (8.6%, a difference of 0.23%), Pueblo (8.5%, a difference of 1.6%), Tsimshian (8.5%, a difference of 1.7%), and Sioux (8.4%, a difference of 2.6%).
| Demographics | Rating | Rank | Male Unemployment |
| Alaska Natives | 0.0 /100 | #331 | Tragic 8.1% |
| Pima | 0.0 /100 | #332 | Tragic 8.3% |
| Sioux | 0.0 /100 | #333 | Tragic 8.4% |
| Tsimshian | 0.0 /100 | #334 | Tragic 8.5% |
| Pueblo | 0.0 /100 | #335 | Tragic 8.5% |
| Yuman | 0.0 /100 | #336 | Tragic 8.6% |
| Puerto Ricans | 0.0 /100 | #337 | Tragic 8.6% |
| Apache | 0.0 /100 | #338 | Tragic 8.6% |
| Cheyenne | 0.0 /100 | #339 | Tragic 9.8% |
| Alaskan Athabascans | 0.0 /100 | #340 | Tragic 9.8% |
| Navajo | 0.0 /100 | #341 | Tragic 9.8% |
| Tohono O'odham | 0.0 /100 | #342 | Tragic 10.2% |
| Crow | 0.0 /100 | #343 | Tragic 10.6% |
| Hopi | 0.0 /100 | #344 | Tragic 10.8% |
| Arapaho | 0.0 /100 | #345 | Tragic 11.0% |