Immigrants from Kuwait vs French Canadian Unemployment Among Ages 16 to 19 years
COMPARE
Immigrants from Kuwait
French Canadian
Unemployment Among Ages 16 to 19 years
Unemployment Among Ages 16 to 19 years Comparison
Immigrants from Kuwait
French Canadians
16.8%
UNEMPLOYMENT AMONG AGES 16 TO 19 YEARS
97.2/ 100
METRIC RATING
85th/ 347
METRIC RANK
16.8%
UNEMPLOYMENT AMONG AGES 16 TO 19 YEARS
97.5/ 100
METRIC RATING
80th/ 347
METRIC RANK
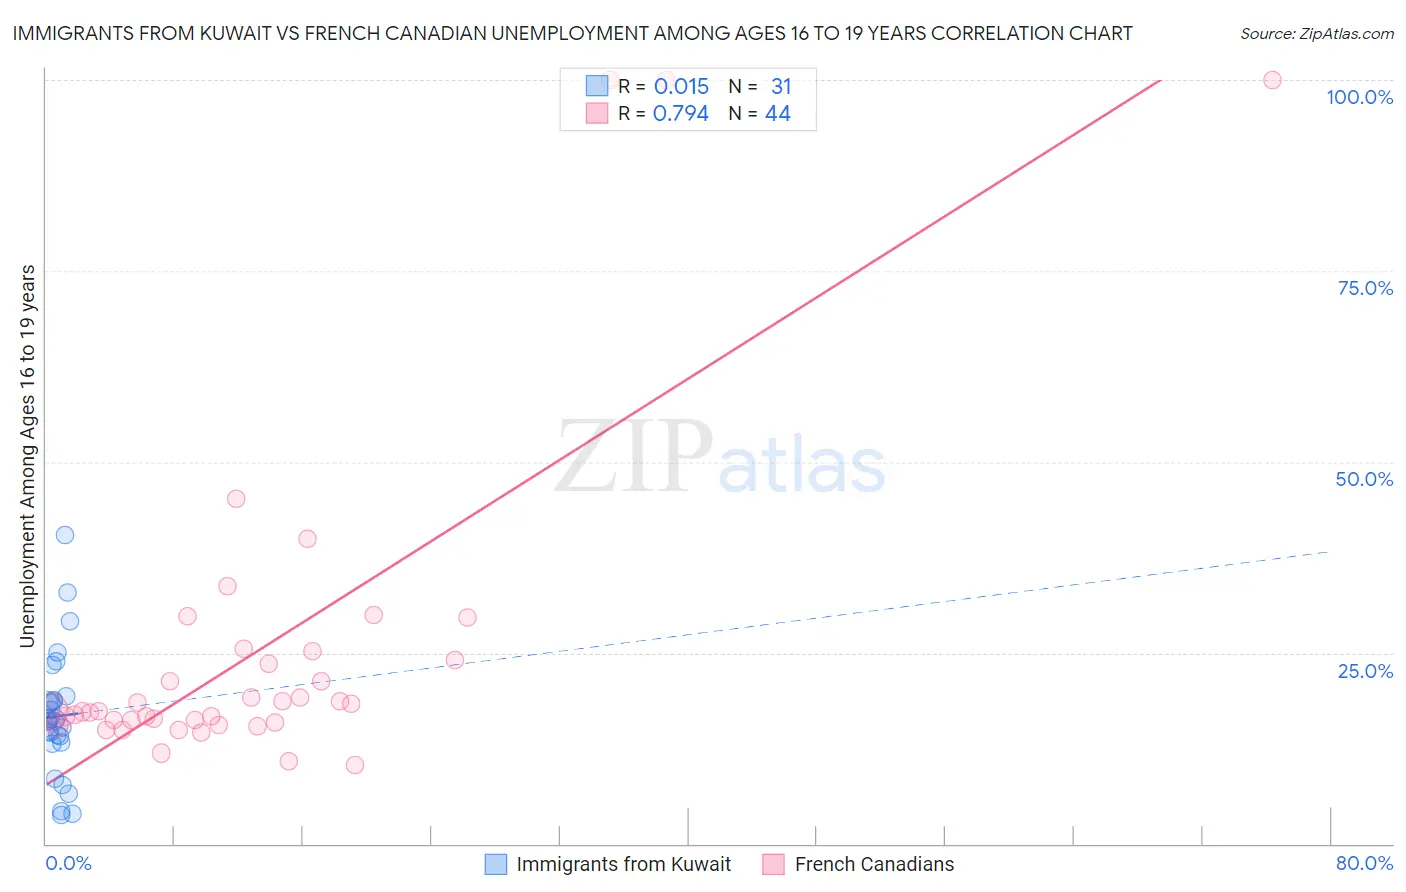
Immigrants from Kuwait vs French Canadian Unemployment Among Ages 16 to 19 years Correlation Chart
The statistical analysis conducted on geographies consisting of 134,574,266 people shows no correlation between the proportion of Immigrants from Kuwait and unemployment rate among population between the ages 16 and 19 in the United States with a correlation coefficient (R) of 0.015 and weighted average of 16.8%. Similarly, the statistical analysis conducted on geographies consisting of 460,845,718 people shows a strong positive correlation between the proportion of French Canadians and unemployment rate among population between the ages 16 and 19 in the United States with a correlation coefficient (R) of 0.794 and weighted average of 16.8%, a difference of 0.13%.
Unemployment Among Ages 16 to 19 years Correlation Summary
| Measurement | Immigrants from Kuwait | French Canadian |
| Minimum | 3.7% | 10.3% |
| Maximum | 40.4% | 100.0% |
| Range | 36.7% | 89.7% |
| Mean | 16.7% | 25.4% |
| Median | 16.1% | 17.3% |
| Interquartile 25% (IQ1) | 13.3% | 16.0% |
| Interquartile 75% (IQ3) | 18.8% | 24.6% |
| Interquartile Range (IQR) | 5.5% | 8.6% |
| Standard Deviation (Sample) | 8.1% | 21.6% |
| Standard Deviation (Population) | 7.9% | 21.4% |
Demographics Similar to Immigrants from Kuwait and French Canadians by Unemployment Among Ages 16 to 19 years
In terms of unemployment among ages 16 to 19 years, the demographic groups most similar to Immigrants from Kuwait are Immigrants from Scotland (16.8%, a difference of 0.010%), French (16.8%, a difference of 0.070%), Greek (16.9%, a difference of 0.080%), Ugandan (16.8%, a difference of 0.11%), and Immigrants from Latvia (16.8%, a difference of 0.13%). Similarly, the demographic groups most similar to French Canadians are Slovak (16.8%, a difference of 0.0%), Immigrants from Latvia (16.8%, a difference of 0.0%), White/Caucasian (16.8%, a difference of 0.010%), Ugandan (16.8%, a difference of 0.020%), and French (16.8%, a difference of 0.060%).
| Demographics | Rating | Rank | Unemployment Among Ages 16 to 19 years |
| Immigrants | Canada | 98.5 /100 | #72 | Exceptional 16.7% |
| Lithuanians | 98.2 /100 | #73 | Exceptional 16.7% |
| Immigrants | Eastern Africa | 98.1 /100 | #74 | Exceptional 16.8% |
| New Zealanders | 98.0 /100 | #75 | Exceptional 16.8% |
| Immigrants | North America | 97.9 /100 | #76 | Exceptional 16.8% |
| Immigrants | Singapore | 97.8 /100 | #77 | Exceptional 16.8% |
| Soviet Union | 97.8 /100 | #78 | Exceptional 16.8% |
| Slovaks | 97.5 /100 | #79 | Exceptional 16.8% |
| French Canadians | 97.5 /100 | #80 | Exceptional 16.8% |
| Immigrants | Latvia | 97.5 /100 | #81 | Exceptional 16.8% |
| Whites/Caucasians | 97.5 /100 | #82 | Exceptional 16.8% |
| Ugandans | 97.4 /100 | #83 | Exceptional 16.8% |
| French | 97.4 /100 | #84 | Exceptional 16.8% |
| Immigrants | Kuwait | 97.2 /100 | #85 | Exceptional 16.8% |
| Immigrants | Scotland | 97.2 /100 | #86 | Exceptional 16.8% |
| Greeks | 97.0 /100 | #87 | Exceptional 16.9% |
| Immigrants | South Africa | 96.9 /100 | #88 | Exceptional 16.9% |
| Canadians | 96.7 /100 | #89 | Exceptional 16.9% |
| Asians | 96.6 /100 | #90 | Exceptional 16.9% |
| Cambodians | 96.3 /100 | #91 | Exceptional 16.9% |
| South Africans | 95.9 /100 | #92 | Exceptional 16.9% |