Immigrants from Kenya vs Serbian Unemployment Among Ages 25 to 29 years
COMPARE
Immigrants from Kenya
Serbian
Unemployment Among Ages 25 to 29 years
Unemployment Among Ages 25 to 29 years Comparison
Immigrants from Kenya
Serbians
6.1%
UNEMPLOYMENT AMONG AGES 25 TO 29 YEARS
99.3/ 100
METRIC RATING
40th/ 347
METRIC RANK
6.4%
UNEMPLOYMENT AMONG AGES 25 TO 29 YEARS
91.7/ 100
METRIC RATING
98th/ 347
METRIC RANK
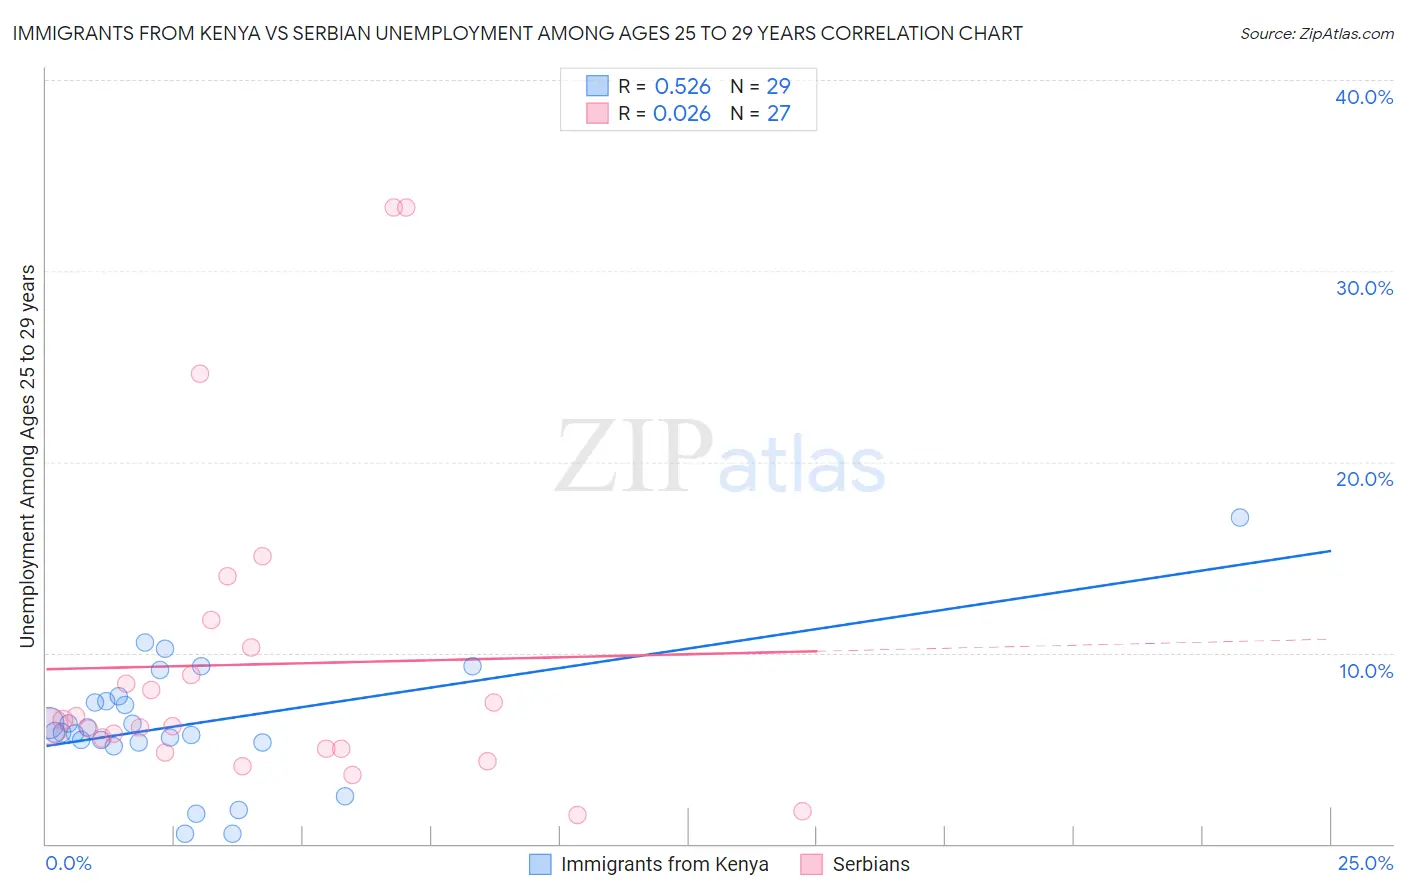
Immigrants from Kenya vs Serbian Unemployment Among Ages 25 to 29 years Correlation Chart
The statistical analysis conducted on geographies consisting of 213,451,821 people shows a substantial positive correlation between the proportion of Immigrants from Kenya and unemployment rate among population between the ages 25 and 29 in the United States with a correlation coefficient (R) of 0.526 and weighted average of 6.1%. Similarly, the statistical analysis conducted on geographies consisting of 256,984,110 people shows no correlation between the proportion of Serbians and unemployment rate among population between the ages 25 and 29 in the United States with a correlation coefficient (R) of 0.026 and weighted average of 6.4%, a difference of 4.2%.
Unemployment Among Ages 25 to 29 years Correlation Summary
| Measurement | Immigrants from Kenya | Serbian |
| Minimum | 0.50% | 1.5% |
| Maximum | 17.1% | 33.3% |
| Range | 16.6% | 31.8% |
| Mean | 6.3% | 9.4% |
| Median | 5.8% | 6.2% |
| Interquartile 25% (IQ1) | 5.3% | 5.0% |
| Interquartile 75% (IQ3) | 7.6% | 10.3% |
| Interquartile Range (IQR) | 2.3% | 5.3% |
| Standard Deviation (Sample) | 3.3% | 8.3% |
| Standard Deviation (Population) | 3.3% | 8.2% |
Similar Demographics by Unemployment Among Ages 25 to 29 years
Demographics Similar to Immigrants from Kenya by Unemployment Among Ages 25 to 29 years
In terms of unemployment among ages 25 to 29 years, the demographic groups most similar to Immigrants from Kenya are Fijian (6.1%, a difference of 0.040%), Jordanian (6.1%, a difference of 0.070%), Indonesian (6.1%, a difference of 0.13%), Czech (6.2%, a difference of 0.20%), and Mongolian (6.2%, a difference of 0.25%).
| Demographics | Rating | Rank | Unemployment Among Ages 25 to 29 years |
| Yugoslavians | 99.6 /100 | #33 | Exceptional 6.1% |
| Immigrants | Morocco | 99.5 /100 | #34 | Exceptional 6.1% |
| Immigrants | Zimbabwe | 99.5 /100 | #35 | Exceptional 6.1% |
| Taiwanese | 99.5 /100 | #36 | Exceptional 6.1% |
| Immigrants | Serbia | 99.5 /100 | #37 | Exceptional 6.1% |
| Ethiopians | 99.4 /100 | #38 | Exceptional 6.1% |
| Indonesians | 99.3 /100 | #39 | Exceptional 6.1% |
| Immigrants | Kenya | 99.3 /100 | #40 | Exceptional 6.1% |
| Fijians | 99.3 /100 | #41 | Exceptional 6.1% |
| Jordanians | 99.3 /100 | #42 | Exceptional 6.1% |
| Czechs | 99.2 /100 | #43 | Exceptional 6.2% |
| Mongolians | 99.2 /100 | #44 | Exceptional 6.2% |
| Venezuelans | 99.1 /100 | #45 | Exceptional 6.2% |
| Immigrants | Lithuania | 99.0 /100 | #46 | Exceptional 6.2% |
| Latvians | 99.0 /100 | #47 | Exceptional 6.2% |
Demographics Similar to Serbians by Unemployment Among Ages 25 to 29 years
In terms of unemployment among ages 25 to 29 years, the demographic groups most similar to Serbians are Immigrants from Eastern Europe (6.4%, a difference of 0.030%), Immigrants from Brazil (6.4%, a difference of 0.090%), Iraqi (6.4%, a difference of 0.090%), Uruguayan (6.4%, a difference of 0.11%), and Immigrants from Ireland (6.4%, a difference of 0.13%).
| Demographics | Rating | Rank | Unemployment Among Ages 25 to 29 years |
| Egyptians | 93.9 /100 | #91 | Exceptional 6.4% |
| Immigrants | North Macedonia | 93.6 /100 | #92 | Exceptional 6.4% |
| Australians | 93.6 /100 | #93 | Exceptional 6.4% |
| Zimbabweans | 93.5 /100 | #94 | Exceptional 6.4% |
| Afghans | 92.5 /100 | #95 | Exceptional 6.4% |
| Immigrants | Brazil | 92.1 /100 | #96 | Exceptional 6.4% |
| Immigrants | Eastern Europe | 91.9 /100 | #97 | Exceptional 6.4% |
| Serbians | 91.7 /100 | #98 | Exceptional 6.4% |
| Iraqis | 91.3 /100 | #99 | Exceptional 6.4% |
| Uruguayans | 91.2 /100 | #100 | Exceptional 6.4% |
| Immigrants | Ireland | 91.1 /100 | #101 | Exceptional 6.4% |
| British | 90.5 /100 | #102 | Exceptional 6.4% |
| Immigrants | Congo | 90.4 /100 | #103 | Exceptional 6.4% |
| Cypriots | 90.1 /100 | #104 | Exceptional 6.4% |
| Immigrants | Kazakhstan | 89.8 /100 | #105 | Excellent 6.4% |