Immigrants from Kazakhstan vs Swiss Male Unemployment
COMPARE
Immigrants from Kazakhstan
Swiss
Male Unemployment
Male Unemployment Comparison
Immigrants from Kazakhstan
Swiss
5.3%
MALE UNEMPLOYMENT
50.8/ 100
METRIC RATING
172nd/ 347
METRIC RANK
4.7%
MALE UNEMPLOYMENT
99.9/ 100
METRIC RATING
16th/ 347
METRIC RANK
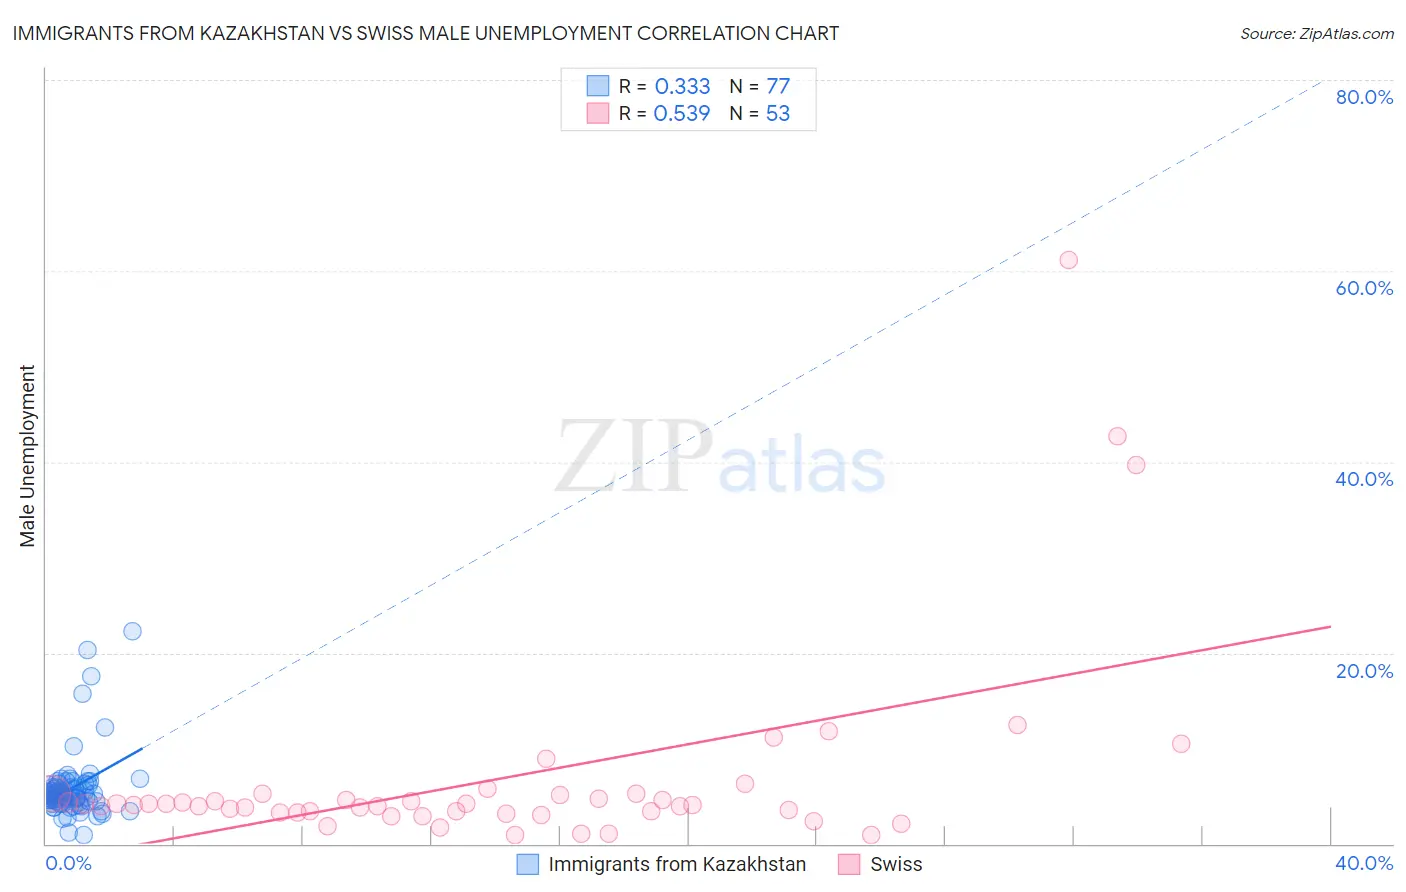
Immigrants from Kazakhstan vs Swiss Male Unemployment Correlation Chart
The statistical analysis conducted on geographies consisting of 124,296,316 people shows a mild positive correlation between the proportion of Immigrants from Kazakhstan and unemployment rate among males in the United States with a correlation coefficient (R) of 0.333 and weighted average of 5.3%. Similarly, the statistical analysis conducted on geographies consisting of 460,477,657 people shows a substantial positive correlation between the proportion of Swiss and unemployment rate among males in the United States with a correlation coefficient (R) of 0.539 and weighted average of 4.7%, a difference of 12.4%.
Male Unemployment Correlation Summary
| Measurement | Immigrants from Kazakhstan | Swiss |
| Minimum | 0.90% | 0.90% |
| Maximum | 22.3% | 61.1% |
| Range | 21.4% | 60.2% |
| Mean | 5.8% | 6.9% |
| Median | 5.1% | 4.1% |
| Interquartile 25% (IQ1) | 4.4% | 3.3% |
| Interquartile 75% (IQ3) | 6.2% | 5.2% |
| Interquartile Range (IQR) | 1.8% | 1.8% |
| Standard Deviation (Sample) | 3.5% | 10.7% |
| Standard Deviation (Population) | 3.5% | 10.6% |
Similar Demographics by Male Unemployment
Demographics Similar to Immigrants from Kazakhstan by Male Unemployment
In terms of male unemployment, the demographic groups most similar to Immigrants from Kazakhstan are Immigrants from Russia (5.3%, a difference of 0.010%), Immigrants from Iran (5.3%, a difference of 0.050%), Peruvian (5.3%, a difference of 0.060%), Immigrants from Iraq (5.3%, a difference of 0.16%), and Immigrants from Eastern Europe (5.3%, a difference of 0.19%).
| Demographics | Rating | Rank | Male Unemployment |
| South Americans | 60.6 /100 | #165 | Good 5.3% |
| Immigrants | Morocco | 60.2 /100 | #166 | Good 5.3% |
| Immigrants | Vietnam | 58.1 /100 | #167 | Average 5.3% |
| Immigrants | Ireland | 57.7 /100 | #168 | Average 5.3% |
| Immigrants | Congo | 57.4 /100 | #169 | Average 5.3% |
| Immigrants | Eastern Europe | 54.1 /100 | #170 | Average 5.3% |
| Peruvians | 51.9 /100 | #171 | Average 5.3% |
| Immigrants | Kazakhstan | 50.8 /100 | #172 | Average 5.3% |
| Immigrants | Russia | 50.7 /100 | #173 | Average 5.3% |
| Immigrants | Iran | 50.0 /100 | #174 | Average 5.3% |
| Immigrants | Iraq | 48.1 /100 | #175 | Average 5.3% |
| Immigrants | Poland | 46.0 /100 | #176 | Average 5.3% |
| Immigrants | Peru | 44.6 /100 | #177 | Average 5.3% |
| Osage | 42.5 /100 | #178 | Average 5.3% |
| Immigrants | Oceania | 40.8 /100 | #179 | Average 5.3% |
Demographics Similar to Swiss by Male Unemployment
In terms of male unemployment, the demographic groups most similar to Swiss are Scandinavian (4.7%, a difference of 0.050%), German (4.7%, a difference of 0.32%), Bolivian (4.7%, a difference of 0.34%), Filipino (4.7%, a difference of 0.73%), and Immigrants from Bolivia (4.7%, a difference of 1.0%).
| Demographics | Rating | Rank | Male Unemployment |
| Thais | 100.0 /100 | #9 | Exceptional 4.6% |
| Cubans | 100.0 /100 | #10 | Exceptional 4.6% |
| Swedes | 100.0 /100 | #11 | Exceptional 4.6% |
| Immigrants | Bolivia | 100.0 /100 | #12 | Exceptional 4.7% |
| Bolivians | 100.0 /100 | #13 | Exceptional 4.7% |
| Germans | 100.0 /100 | #14 | Exceptional 4.7% |
| Scandinavians | 100.0 /100 | #15 | Exceptional 4.7% |
| Swiss | 99.9 /100 | #16 | Exceptional 4.7% |
| Filipinos | 99.9 /100 | #17 | Exceptional 4.7% |
| English | 99.9 /100 | #18 | Exceptional 4.8% |
| Europeans | 99.9 /100 | #19 | Exceptional 4.8% |
| Pennsylvania Germans | 99.9 /100 | #20 | Exceptional 4.8% |
| Immigrants | Taiwan | 99.9 /100 | #21 | Exceptional 4.8% |
| Carpatho Rusyns | 99.9 /100 | #22 | Exceptional 4.8% |
| Tongans | 99.9 /100 | #23 | Exceptional 4.8% |