Immigrants from Kazakhstan vs Portuguese Unemployment Among Ages 45 to 54 years

COMPARE

Immigrants from Kazakhstan
Race
Ancestry
AfghanAfricanAlaska NativeAlaskan AthabascanAlbanianAleutAlsatianAmericanApacheArabArapahoArgentineanArmenianAssyrian/Chaldean/SyriacAustralianAustrianBahamianBangladeshiBarbadianBasqueBelgianBelizeanBermudanBhutaneseBlackfeetBolivianBrazilianBritishBritish West IndianBulgarianBurmeseCajunCambodianCanadianCape VerdeanCarpatho RusynCelticCentral AmericanCentral American IndianCherokeeCheyenneChickasawChileanChineseChippewaChoctawColombianColvilleComancheCosta RicanCreeCreekCroatianCrowCubanCypriotCzechCzechoslovakianDanishDelawareDominicanDutchDutch West IndianEastern EuropeanEcuadorianEgyptianEnglishEstonianEthiopianEuropeanFijianFilipinoFinnishFrenchFrench American IndianFrench CanadianGermanGerman RussianGhanaianGreekGuamanian/ChamorroGuatemalanGuyaneseHaitianHmongHonduranHopiHoumaHungarianIcelanderIndian (Asian)IndonesianInupiatIranianIraqiIrishIroquoisIsraeliItalianJamaicanJapaneseJordanianKenyanKiowaKoreanLaotianLatvianLebaneseLiberianLithuanianLumbeeLuxembourgerMacedonianMalaysianMalteseMarshalleseMenomineeMexicanMexican American IndianMongolianMoroccanNative HawaiianNavajoNepaleseNew ZealanderNicaraguanNigerianNorthern EuropeanNorwegianOkinawanOsageOttawaPaiutePakistaniPalestinianPanamanianParaguayanPennsylvania GermanPeruvianPimaPolishPotawatomiPuebloPuerto RicanPuget Sound SalishRomanianRussianSalvadoranSamoanScandinavianScotch-IrishScottishSeminoleSenegaleseSerbianShoshoneSierra LeoneanSiouxSlavicSlovakSloveneSomaliSouth AfricanSouth AmericanSouth American IndianSoviet UnionSpaniardSpanishSpanish AmericanSpanish American IndianSri LankanSubsaharan AfricanSudaneseSwedishSwissSyrianTaiwaneseThaiTlingit-HaidaTohono O'OdhamTonganTrinidadian and TobagonianTsimshianTurkishU.S. Virgin IslanderUgandanUkrainianUruguayanUteVenezuelanVietnameseWelshWest IndianYakamaYaquiYugoslavianYumanYup'ikZimbabwean
Immigration
NonimmigrantsImmigrantsAfghanistanAfricaAlbaniaArgentinaArmeniaAsiaAustraliaAustriaBahamasBangladeshBarbadosBelarusBelgiumBelizeBoliviaBosnia and HerzegovinaBrazilBulgariaBurma/MyanmarCabo VerdeCambodiaCameroonCanadaCaribbeanCentral AmericaChileChinaColombiaCongoCosta RicaCroatiaCubaCzechoslovakiaDenmarkDominicaDominican RepublicEastern AfricaEastern AsiaEastern EuropeEcuadorEgyptEl SalvadorEnglandEritreaEthiopiaEuropeFijiFranceGermanyGhanaGreeceGrenadaGuatemalaGuyanaHaitiHondurasHong KongHungaryIndiaIndonesiaIranIraqIrelandIsraelItalyJamaicaJapanJordanKazakhstanKenyaKoreaKuwaitLaosLatin AmericaLatviaLebanonLiberiaLithuaniaMalaysiaMexicoMicronesiaMiddle AfricaMoldovaMoroccoNepalNetherlandsNicaraguaNigeriaNorth AmericaNorth MacedoniaNorthern AfricaNorthern EuropeNorwayOceaniaPakistanPanamaPeruPhilippinesPolandPortugalRomaniaRussiaSaudi ArabiaScotlandSenegalSerbiaSierra LeoneSingaporeSomaliaSouth AfricaSouth AmericaSouth Central AsiaSouth Eastern AsiaSouthern EuropeSpainSri LankaSt. Vincent and the GrenadinesSudanSwedenSwitzerlandSyriaTaiwanThailandTrinidad and TobagoTurkeyUgandaUkraineUruguayUzbekistanVenezuelaVietnamWest IndiesWestern AfricaWestern AsiaWestern EuropeYemenZaireZimbabweAzores
Portuguese
Race
Ancestry
AfghanAfricanAlaska NativeAlaskan AthabascanAlbanianAleutAlsatianAmericanApacheArabArapahoArgentineanArmenianAssyrian/Chaldean/SyriacAustralianAustrianBahamianBangladeshiBarbadianBasqueBelgianBelizeanBermudanBhutaneseBlackfeetBolivianBrazilianBritishBritish West IndianBulgarianBurmeseCajunCambodianCanadianCape VerdeanCarpatho RusynCelticCentral AmericanCentral American IndianCherokeeCheyenneChickasawChileanChineseChippewaChoctawColombianColvilleComancheCosta RicanCreeCreekCroatianCrowCubanCypriotCzechCzechoslovakianDanishDelawareDominicanDutchDutch West IndianEastern EuropeanEcuadorianEgyptianEnglishEstonianEthiopianEuropeanFijianFilipinoFinnishFrenchFrench American IndianFrench CanadianGermanGerman RussianGhanaianGreekGuamanian/ChamorroGuatemalanGuyaneseHaitianHmongHonduranHopiHoumaHungarianIcelanderIndian (Asian)IndonesianInupiatIranianIraqiIrishIroquoisIsraeliItalianJamaicanJapaneseJordanianKenyanKiowaKoreanLaotianLatvianLebaneseLiberianLithuanianLumbeeLuxembourgerMacedonianMalaysianMalteseMarshalleseMenomineeMexicanMexican American IndianMongolianMoroccanNative HawaiianNavajoNepaleseNew ZealanderNicaraguanNigerianNorthern EuropeanNorwegianOkinawanOsageOttawaPaiutePakistaniPalestinianPanamanianParaguayanPennsylvania GermanPeruvianPimaPolishPortuguesePotawatomiPuebloPuerto RicanPuget Sound SalishRomanianRussianSalvadoranSamoanScandinavianScotch-IrishScottishSeminoleSenegaleseSerbianShoshoneSierra LeoneanSiouxSlavicSlovakSloveneSomaliSouth AfricanSouth AmericanSouth American IndianSoviet UnionSpaniardSpanishSpanish AmericanSpanish American IndianSri LankanSubsaharan AfricanSudaneseSwedishSwissSyrianTaiwaneseThaiTlingit-HaidaTohono O'OdhamTonganTrinidadian and TobagonianTsimshianTurkishU.S. Virgin IslanderUgandanUkrainianUruguayanUteVenezuelanVietnameseWelshWest IndianYakamaYaquiYugoslavianYumanYup'ikZimbabwean
Immigration
NonimmigrantsImmigrantsAfghanistanAfricaAlbaniaArgentinaArmeniaAsiaAustraliaAustriaBahamasBangladeshBarbadosBelarusBelgiumBelizeBoliviaBosnia and HerzegovinaBrazilBulgariaBurma/MyanmarCabo VerdeCambodiaCameroonCanadaCaribbeanCentral AmericaChileChinaColombiaCongoCosta RicaCroatiaCubaCzechoslovakiaDenmarkDominicaDominican RepublicEastern AfricaEastern AsiaEastern EuropeEcuadorEgyptEl SalvadorEnglandEritreaEthiopiaEuropeFijiFranceGermanyGhanaGreeceGrenadaGuatemalaGuyanaHaitiHondurasHong KongHungaryIndiaIndonesiaIranIraqIrelandIsraelItalyJamaicaJapanJordanKenyaKoreaKuwaitLaosLatin AmericaLatviaLebanonLiberiaLithuaniaMalaysiaMexicoMicronesiaMiddle AfricaMoldovaMoroccoNepalNetherlandsNicaraguaNigeriaNorth AmericaNorth MacedoniaNorthern AfricaNorthern EuropeNorwayOceaniaPakistanPanamaPeruPhilippinesPolandPortugalRomaniaRussiaSaudi ArabiaScotlandSenegalSerbiaSierra LeoneSingaporeSomaliaSouth AfricaSouth AmericaSouth Central AsiaSouth Eastern AsiaSouthern EuropeSpainSri LankaSt. Vincent and the GrenadinesSudanSwedenSwitzerlandSyriaTaiwanThailandTrinidad and TobagoTurkeyUgandaUkraineUruguayUzbekistanVenezuelaVietnamWest IndiesWestern AfricaWestern AsiaWestern EuropeYemenZaireZimbabweAzores
Unemployment Among Ages 45 to 54 years
Income
Poverty
Unemployment
Labor Participation
Family Structure
Vehicle Availability
Education Level
Disability

Unemployment Among Ages 45 to 54 years Comparison

Immigrants from Kazakhstan

Portuguese

Excellent
Tragic
4.4%
UNEMPLOYMENT AMONG AGES 45 TO 54 YEARS
89.5/ 100
METRIC RATING
122nd/ 347
METRIC RANK
4.8%
UNEMPLOYMENT AMONG AGES 45 TO 54 YEARS
1.1/ 100
METRIC RATING
243rd/ 347
METRIC RANK

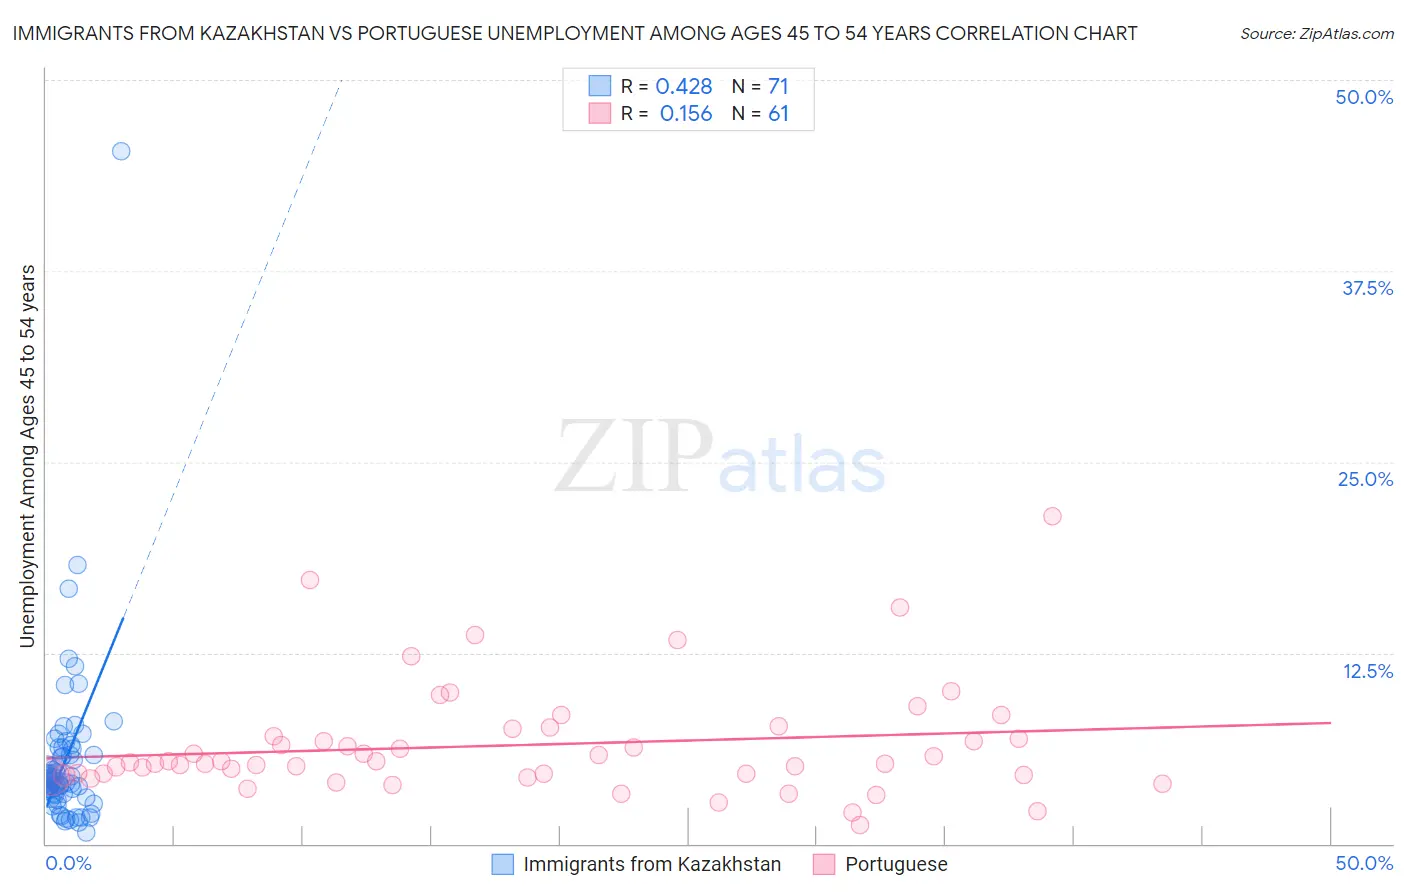
Immigrants from Kazakhstan vs Portuguese Unemployment Among Ages 45 to 54 years Correlation Chart

The statistical analysis conducted on geographies consisting of 123,647,283 people shows a moderate positive correlation between the proportion of Immigrants from Kazakhstan and unemployment rate among population between the ages 45 and 54 in the United States with a correlation coefficient (R) of 0.428 and weighted average of 4.4%. Similarly, the statistical analysis conducted on geographies consisting of 434,727,721 people shows a poor positive correlation between the proportion of Portuguese and unemployment rate among population between the ages 45 and 54 in the United States with a correlation coefficient (R) of 0.156 and weighted average of 4.8%, a difference of 7.9%.
Immigrants from Kazakhstan vs Portuguese Unemployment Among Ages 45 to 54 years

Unemployment Among Ages 45 to 54 years Correlation Summary

MeasurementImmigrants from KazakhstanPortuguese
Minimum0.70%1.2%
Maximum45.3%21.4%
Range44.6%20.2%
Mean5.5%6.5%
Median4.2%5.3%
Interquartile 25% (IQ1)3.2%4.5%
Interquartile 75% (IQ3)6.2%7.3%
Interquartile Range (IQR)3.0%2.8%
Standard Deviation (Sample)5.8%3.7%
Standard Deviation (Population)5.7%3.6%

Similar Demographics by Unemployment Among Ages 45 to 54 years

Demographics Similar to Immigrants from Kazakhstan by Unemployment Among Ages 45 to 54 years

In terms of unemployment among ages 45 to 54 years, the demographic groups most similar to Immigrants from Kazakhstan are American (4.4%, a difference of 0.010%), Immigrants from Oceania (4.4%, a difference of 0.010%), Native Hawaiian (4.4%, a difference of 0.060%), Immigrants from Romania (4.4%, a difference of 0.070%), and Immigrants from Asia (4.4%, a difference of 0.090%).
DemographicsRating | RankUnemployment Among Ages 45 to 54 years
Pakistanis
90.7
/100
|
#115
Exceptional
4.4%
Immigrants | North Macedonia
90.6
/100
|
#116
Exceptional
4.4%
South Africans
90.4
/100
|
#117
Exceptional
4.4%
Immigrants | Romania
90.0
/100
|
#118
Exceptional
4.4%
Native Hawaiians
90.0
/100
|
#119
Excellent
4.4%
Americans
89.6
/100
|
#120
Excellent
4.4%
Immigrants | Oceania
89.5
/100
|
#121
Excellent
4.4%
Immigrants | Kazakhstan
89.5
/100
|
#122
Excellent
4.4%
Immigrants | Asia
88.8
/100
|
#123
Excellent
4.4%
Spanish
88.8
/100
|
#124
Excellent
4.4%
Immigrants | Vietnam
88.6
/100
|
#125
Excellent
4.4%
Immigrants | Czechoslovakia
87.8
/100
|
#126
Excellent
4.4%
Nicaraguans
87.6
/100
|
#127
Excellent
4.4%
Immigrants | Northern Europe
86.9
/100
|
#128
Excellent
4.4%
Laotians
86.3
/100
|
#129
Excellent
4.4%

Demographics Similar to Portuguese by Unemployment Among Ages 45 to 54 years

In terms of unemployment among ages 45 to 54 years, the demographic groups most similar to Portuguese are Seminole (4.8%, a difference of 0.060%), Central American (4.8%, a difference of 0.11%), Delaware (4.8%, a difference of 0.12%), Immigrants from Iraq (4.7%, a difference of 0.19%), and Immigrants from Albania (4.8%, a difference of 0.21%).
DemographicsRating | RankUnemployment Among Ages 45 to 54 years
Tlingit-Haida
2.3
/100
|
#236
Tragic
4.7%
Alsatians
1.6
/100
|
#237
Tragic
4.7%
Yaqui
1.4
/100
|
#238
Tragic
4.7%
Spanish Americans
1.4
/100
|
#239
Tragic
4.7%
Immigrants | Iraq
1.3
/100
|
#240
Tragic
4.7%
Delaware
1.3
/100
|
#241
Tragic
4.8%
Central Americans
1.3
/100
|
#242
Tragic
4.8%
Portuguese
1.1
/100
|
#243
Tragic
4.8%
Seminole
1.1
/100
|
#244
Tragic
4.8%
Immigrants | Albania
0.9
/100
|
#245
Tragic
4.8%
Immigrants | Syria
0.9
/100
|
#246
Tragic
4.8%
Israelis
0.9
/100
|
#247
Tragic
4.8%
Immigrants | Liberia
0.8
/100
|
#248
Tragic
4.8%
Immigrants | Honduras
0.7
/100
|
#249
Tragic
4.8%
Salvadorans
0.7
/100
|
#250
Tragic
4.8%