Immigrants from Kazakhstan vs Immigrants from France Unemployment Among Women with Children Under 6 years
COMPARE
Immigrants from Kazakhstan
Immigrants from France
Unemployment Among Women with Children Under 6 years
Unemployment Among Women with Children Under 6 years Comparison
Immigrants from Kazakhstan
Immigrants from France
7.2%
UNEMPLOYMENT AMONG WOMEN WITH CHILDREN UNDER 6 YEARS
97.1/ 100
METRIC RATING
107th/ 347
METRIC RANK
6.9%
UNEMPLOYMENT AMONG WOMEN WITH CHILDREN UNDER 6 YEARS
99.7/ 100
METRIC RATING
61st/ 347
METRIC RANK
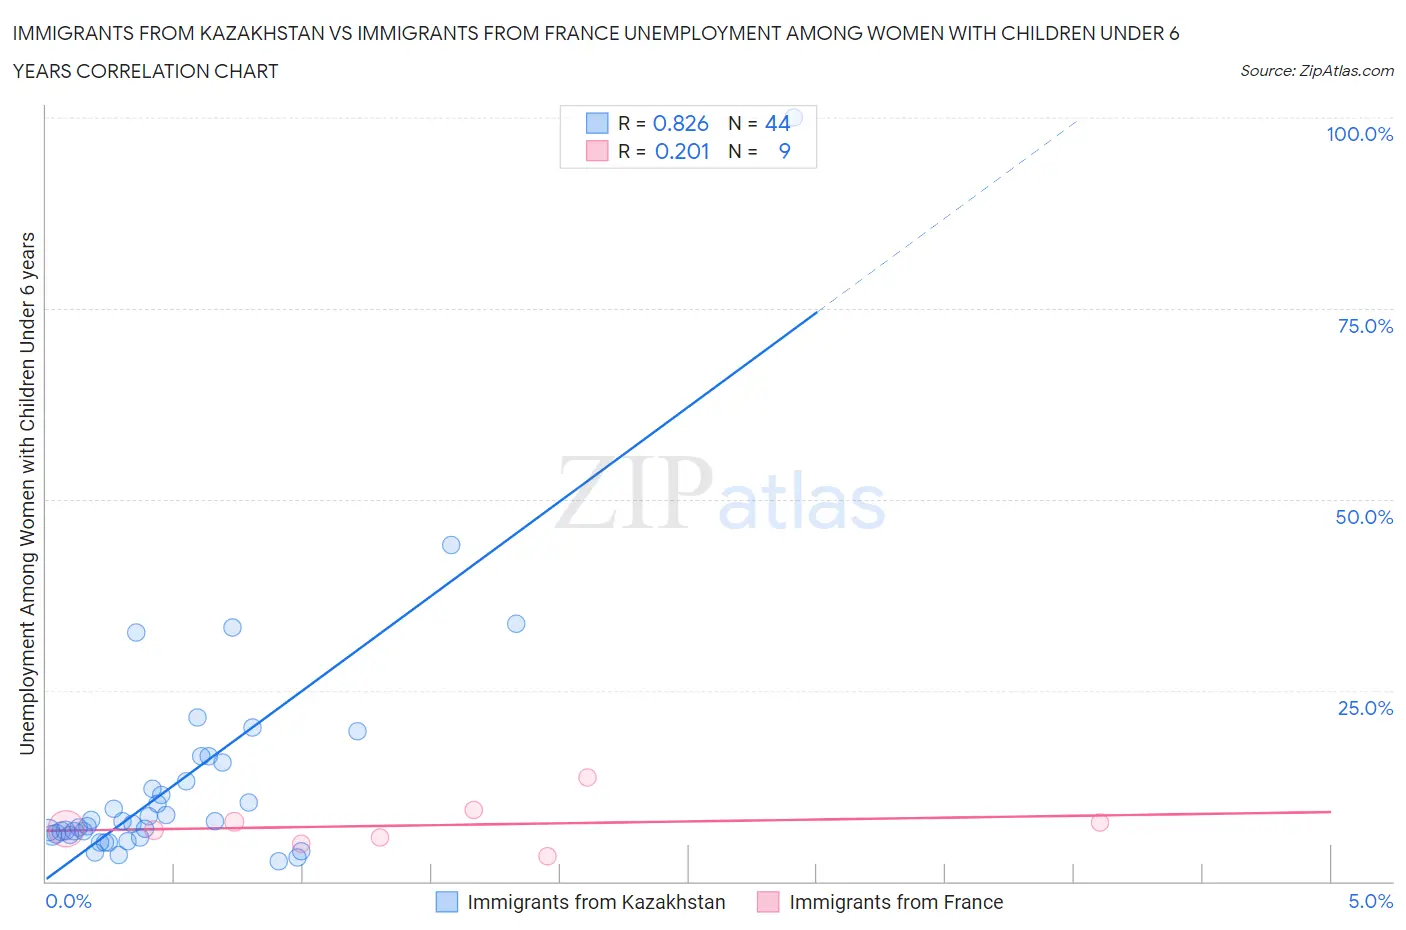
Immigrants from Kazakhstan vs Immigrants from France Unemployment Among Women with Children Under 6 years Correlation Chart
The statistical analysis conducted on geographies consisting of 109,712,077 people shows a very strong positive correlation between the proportion of Immigrants from Kazakhstan and unemployment rate among women with children under the age of 6 in the United States with a correlation coefficient (R) of 0.826 and weighted average of 7.2%. Similarly, the statistical analysis conducted on geographies consisting of 232,581,011 people shows a weak positive correlation between the proportion of Immigrants from France and unemployment rate among women with children under the age of 6 in the United States with a correlation coefficient (R) of 0.201 and weighted average of 6.9%, a difference of 4.3%.
Unemployment Among Women with Children Under 6 years Correlation Summary
| Measurement | Immigrants from Kazakhstan | Immigrants from France |
| Minimum | 2.6% | 3.3% |
| Maximum | 100.0% | 13.6% |
| Range | 97.4% | 10.3% |
| Mean | 13.3% | 7.3% |
| Median | 7.7% | 6.9% |
| Interquartile 25% (IQ1) | 6.0% | 5.3% |
| Interquartile 75% (IQ3) | 14.3% | 8.5% |
| Interquartile Range (IQR) | 8.3% | 3.2% |
| Standard Deviation (Sample) | 16.2% | 2.9% |
| Standard Deviation (Population) | 16.1% | 2.8% |
Similar Demographics by Unemployment Among Women with Children Under 6 years
Demographics Similar to Immigrants from Kazakhstan by Unemployment Among Women with Children Under 6 years
In terms of unemployment among women with children under 6 years, the demographic groups most similar to Immigrants from Kazakhstan are Immigrants from Pakistan (7.2%, a difference of 0.020%), Venezuelan (7.2%, a difference of 0.030%), Immigrants from Egypt (7.2%, a difference of 0.040%), Immigrants from Nicaragua (7.2%, a difference of 0.12%), and Immigrants from Saudi Arabia (7.2%, a difference of 0.12%).
| Demographics | Rating | Rank | Unemployment Among Women with Children Under 6 years |
| Immigrants | Northern Europe | 97.4 /100 | #100 | Exceptional 7.2% |
| Chileans | 97.4 /100 | #101 | Exceptional 7.2% |
| Immigrants | Nicaragua | 97.3 /100 | #102 | Exceptional 7.2% |
| Immigrants | Saudi Arabia | 97.3 /100 | #103 | Exceptional 7.2% |
| Immigrants | Egypt | 97.2 /100 | #104 | Exceptional 7.2% |
| Venezuelans | 97.2 /100 | #105 | Exceptional 7.2% |
| Immigrants | Pakistan | 97.2 /100 | #106 | Exceptional 7.2% |
| Immigrants | Kazakhstan | 97.1 /100 | #107 | Exceptional 7.2% |
| Eastern Europeans | 96.9 /100 | #108 | Exceptional 7.2% |
| Australians | 96.9 /100 | #109 | Exceptional 7.2% |
| Palestinians | 96.8 /100 | #110 | Exceptional 7.2% |
| Norwegians | 96.7 /100 | #111 | Exceptional 7.2% |
| Israelis | 96.5 /100 | #112 | Exceptional 7.2% |
| Nicaraguans | 96.3 /100 | #113 | Exceptional 7.2% |
| Argentineans | 96.2 /100 | #114 | Exceptional 7.2% |
Demographics Similar to Immigrants from France by Unemployment Among Women with Children Under 6 years
In terms of unemployment among women with children under 6 years, the demographic groups most similar to Immigrants from France are Somali (6.9%, a difference of 0.040%), Maltese (6.9%, a difference of 0.090%), Tongan (6.9%, a difference of 0.19%), Immigrants from Kuwait (6.9%, a difference of 0.33%), and Immigrants from Sri Lanka (6.9%, a difference of 0.37%).
| Demographics | Rating | Rank | Unemployment Among Women with Children Under 6 years |
| Immigrants | Latvia | 99.9 /100 | #54 | Exceptional 6.8% |
| Immigrants | Ukraine | 99.8 /100 | #55 | Exceptional 6.8% |
| Immigrants | Ethiopia | 99.8 /100 | #56 | Exceptional 6.9% |
| Icelanders | 99.8 /100 | #57 | Exceptional 6.9% |
| Immigrants | Turkey | 99.8 /100 | #58 | Exceptional 6.9% |
| Immigrants | Serbia | 99.8 /100 | #59 | Exceptional 6.9% |
| Immigrants | Sri Lanka | 99.8 /100 | #60 | Exceptional 6.9% |
| Immigrants | France | 99.7 /100 | #61 | Exceptional 6.9% |
| Somalis | 99.7 /100 | #62 | Exceptional 6.9% |
| Maltese | 99.7 /100 | #63 | Exceptional 6.9% |
| Tongans | 99.7 /100 | #64 | Exceptional 6.9% |
| Immigrants | Kuwait | 99.7 /100 | #65 | Exceptional 6.9% |
| Immigrants | Belgium | 99.6 /100 | #66 | Exceptional 6.9% |
| Immigrants | Netherlands | 99.5 /100 | #67 | Exceptional 7.0% |
| Paraguayans | 99.4 /100 | #68 | Exceptional 7.0% |