Immigrants from Japan vs Immigrants from Singapore Unemployment Among Ages 30 to 34 years
COMPARE
Immigrants from Japan
Immigrants from Singapore
Unemployment Among Ages 30 to 34 years
Unemployment Among Ages 30 to 34 years Comparison
Immigrants from Japan
Immigrants from Singapore
5.1%
UNEMPLOYMENT AMONG AGES 30 TO 34 YEARS
96.8/ 100
METRIC RATING
65th/ 347
METRIC RANK
5.0%
UNEMPLOYMENT AMONG AGES 30 TO 34 YEARS
99.5/ 100
METRIC RATING
25th/ 347
METRIC RANK
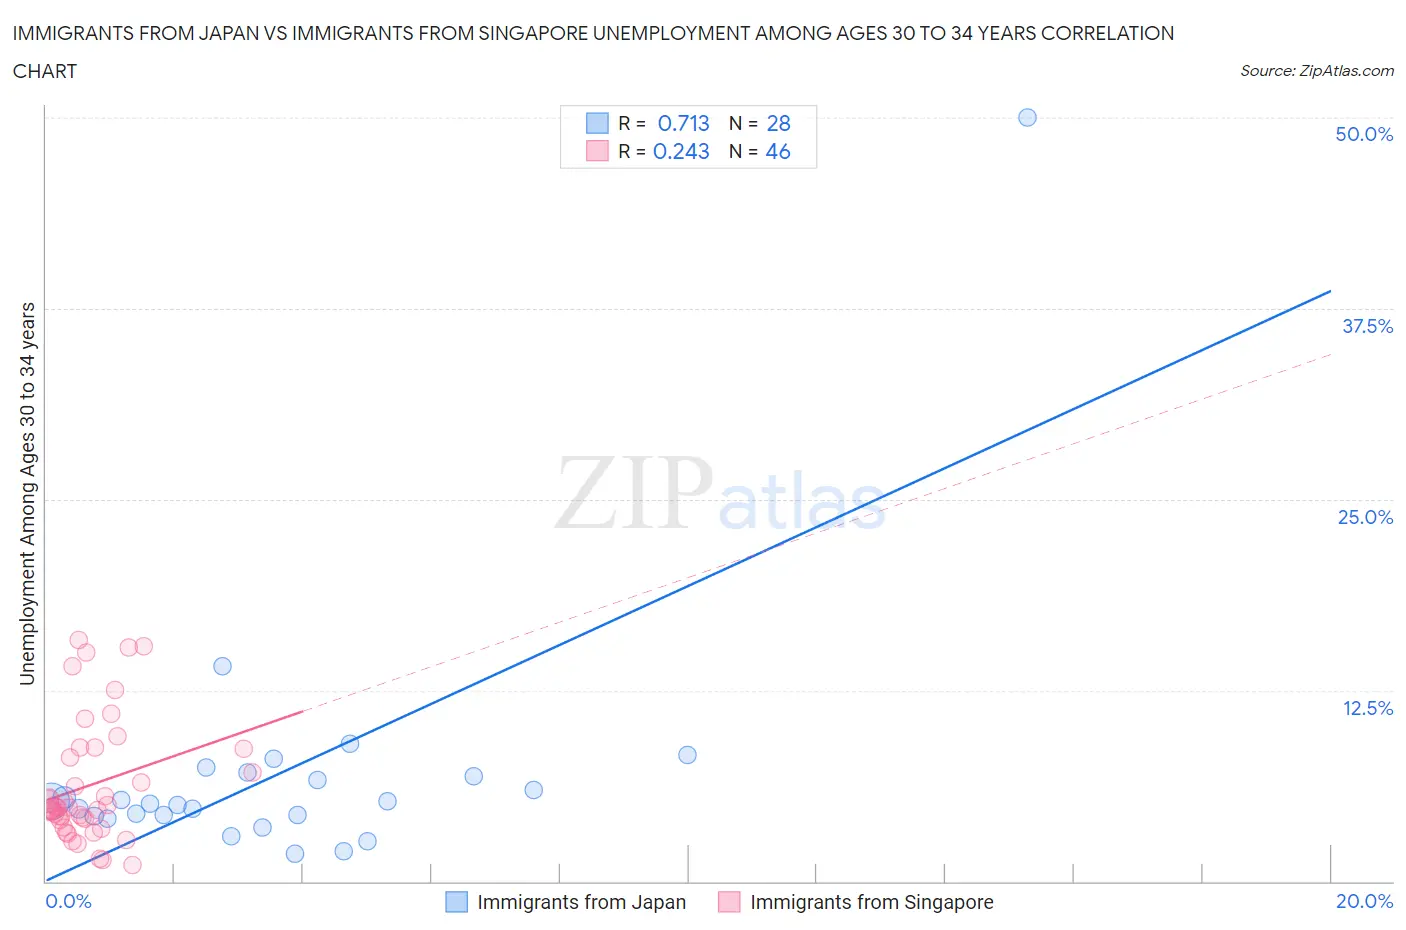
Immigrants from Japan vs Immigrants from Singapore Unemployment Among Ages 30 to 34 years Correlation Chart
The statistical analysis conducted on geographies consisting of 324,511,302 people shows a strong positive correlation between the proportion of Immigrants from Japan and unemployment rate among population between the ages 30 and 34 in the United States with a correlation coefficient (R) of 0.713 and weighted average of 5.1%. Similarly, the statistical analysis conducted on geographies consisting of 134,759,507 people shows a weak positive correlation between the proportion of Immigrants from Singapore and unemployment rate among population between the ages 30 and 34 in the United States with a correlation coefficient (R) of 0.243 and weighted average of 5.0%, a difference of 3.7%.
Unemployment Among Ages 30 to 34 years Correlation Summary
| Measurement | Immigrants from Japan | Immigrants from Singapore |
| Minimum | 1.8% | 1.1% |
| Maximum | 50.0% | 15.8% |
| Range | 48.2% | 14.7% |
| Mean | 7.1% | 6.3% |
| Median | 5.1% | 4.8% |
| Interquartile 25% (IQ1) | 4.3% | 4.1% |
| Interquartile 75% (IQ3) | 7.0% | 8.7% |
| Interquartile Range (IQR) | 2.7% | 4.6% |
| Standard Deviation (Sample) | 8.8% | 4.0% |
| Standard Deviation (Population) | 8.6% | 3.9% |
Similar Demographics by Unemployment Among Ages 30 to 34 years
Demographics Similar to Immigrants from Japan by Unemployment Among Ages 30 to 34 years
In terms of unemployment among ages 30 to 34 years, the demographic groups most similar to Immigrants from Japan are Immigrants from Eastern Asia (5.1%, a difference of 0.070%), Immigrants from Zimbabwe (5.1%, a difference of 0.070%), Belgian (5.1%, a difference of 0.10%), Immigrants from France (5.1%, a difference of 0.11%), and Indian (Asian) (5.1%, a difference of 0.13%).
| Demographics | Rating | Rank | Unemployment Among Ages 30 to 34 years |
| Asians | 97.2 /100 | #58 | Exceptional 5.1% |
| Swedes | 97.1 /100 | #59 | Exceptional 5.1% |
| Immigrants | Somalia | 97.1 /100 | #60 | Exceptional 5.1% |
| Indians (Asian) | 97.0 /100 | #61 | Exceptional 5.1% |
| Immigrants | France | 97.0 /100 | #62 | Exceptional 5.1% |
| Belgians | 97.0 /100 | #63 | Exceptional 5.1% |
| Immigrants | Eastern Asia | 96.9 /100 | #64 | Exceptional 5.1% |
| Immigrants | Japan | 96.8 /100 | #65 | Exceptional 5.1% |
| Immigrants | Zimbabwe | 96.7 /100 | #66 | Exceptional 5.1% |
| Burmese | 96.5 /100 | #67 | Exceptional 5.1% |
| Jordanians | 96.5 /100 | #68 | Exceptional 5.1% |
| Immigrants | Northern Africa | 96.4 /100 | #69 | Exceptional 5.1% |
| Immigrants | Iraq | 96.4 /100 | #70 | Exceptional 5.1% |
| Paraguayans | 96.4 /100 | #71 | Exceptional 5.1% |
| Immigrants | Moldova | 96.4 /100 | #72 | Exceptional 5.1% |
Demographics Similar to Immigrants from Singapore by Unemployment Among Ages 30 to 34 years
In terms of unemployment among ages 30 to 34 years, the demographic groups most similar to Immigrants from Singapore are Immigrants from Kuwait (5.0%, a difference of 0.17%), Danish (5.0%, a difference of 0.27%), Immigrants from Cuba (5.0%, a difference of 0.52%), German Russian (5.0%, a difference of 0.54%), and Norwegian (5.0%, a difference of 0.56%).
| Demographics | Rating | Rank | Unemployment Among Ages 30 to 34 years |
| Bolivians | 99.8 /100 | #18 | Exceptional 4.9% |
| Immigrants | Sudan | 99.8 /100 | #19 | Exceptional 4.9% |
| Immigrants | Taiwan | 99.8 /100 | #20 | Exceptional 4.9% |
| Ethiopians | 99.8 /100 | #21 | Exceptional 4.9% |
| Immigrants | South Central Asia | 99.8 /100 | #22 | Exceptional 4.9% |
| Hmong | 99.8 /100 | #23 | Exceptional 4.9% |
| Ugandans | 99.7 /100 | #24 | Exceptional 4.9% |
| Immigrants | Singapore | 99.5 /100 | #25 | Exceptional 5.0% |
| Immigrants | Kuwait | 99.5 /100 | #26 | Exceptional 5.0% |
| Danes | 99.5 /100 | #27 | Exceptional 5.0% |
| Immigrants | Cuba | 99.4 /100 | #28 | Exceptional 5.0% |
| German Russians | 99.4 /100 | #29 | Exceptional 5.0% |
| Norwegians | 99.4 /100 | #30 | Exceptional 5.0% |
| Somalis | 99.3 /100 | #31 | Exceptional 5.0% |
| Immigrants | Zaire | 99.3 /100 | #32 | Exceptional 5.0% |