Immigrants from Jamaica vs Subsaharan African Unemployment Among Ages 65 to 74 years
COMPARE
Immigrants from Jamaica
Subsaharan African
Unemployment Among Ages 65 to 74 years
Unemployment Among Ages 65 to 74 years Comparison
Immigrants from Jamaica
Sub-Saharan Africans
5.6%
UNEMPLOYMENT AMONG AGES 65 TO 74 YEARS
0.2/ 100
METRIC RATING
263rd/ 347
METRIC RANK
5.4%
UNEMPLOYMENT AMONG AGES 65 TO 74 YEARS
14.4/ 100
METRIC RATING
202nd/ 347
METRIC RANK
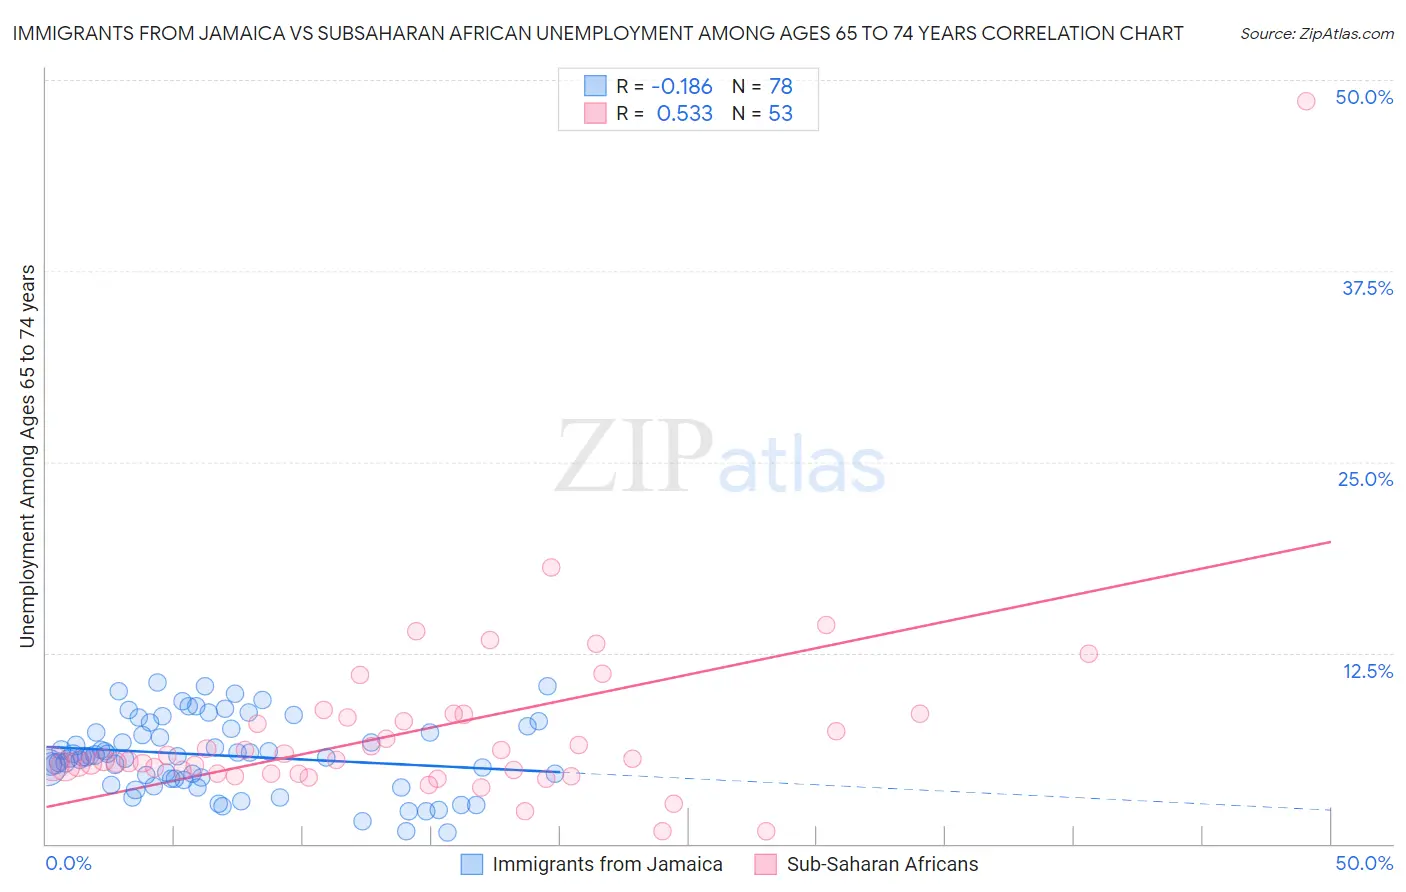
Immigrants from Jamaica vs Subsaharan African Unemployment Among Ages 65 to 74 years Correlation Chart
The statistical analysis conducted on geographies consisting of 273,118,315 people shows a poor negative correlation between the proportion of Immigrants from Jamaica and unemployment rate among population between the ages 65 and 74 in the United States with a correlation coefficient (R) of -0.186 and weighted average of 5.6%. Similarly, the statistical analysis conducted on geographies consisting of 423,071,215 people shows a substantial positive correlation between the proportion of Sub-Saharan Africans and unemployment rate among population between the ages 65 and 74 in the United States with a correlation coefficient (R) of 0.533 and weighted average of 5.4%, a difference of 3.7%.
Unemployment Among Ages 65 to 74 years Correlation Summary
| Measurement | Immigrants from Jamaica | Subsaharan African |
| Minimum | 0.70% | 0.80% |
| Maximum | 10.6% | 48.6% |
| Range | 9.9% | 47.8% |
| Mean | 5.8% | 7.4% |
| Median | 5.7% | 5.5% |
| Interquartile 25% (IQ1) | 4.2% | 4.6% |
| Interquartile 75% (IQ3) | 7.5% | 8.4% |
| Interquartile Range (IQR) | 3.3% | 3.8% |
| Standard Deviation (Sample) | 2.4% | 6.7% |
| Standard Deviation (Population) | 2.4% | 6.6% |
Similar Demographics by Unemployment Among Ages 65 to 74 years
Demographics Similar to Immigrants from Jamaica by Unemployment Among Ages 65 to 74 years
In terms of unemployment among ages 65 to 74 years, the demographic groups most similar to Immigrants from Jamaica are Immigrants from St. Vincent and the Grenadines (5.6%, a difference of 0.010%), Pueblo (5.6%, a difference of 0.010%), Jamaican (5.6%, a difference of 0.050%), South American (5.6%, a difference of 0.060%), and French Canadian (5.6%, a difference of 0.090%).
| Demographics | Rating | Rank | Unemployment Among Ages 65 to 74 years |
| Native Hawaiians | 0.4 /100 | #256 | Tragic 5.6% |
| Immigrants | Southern Europe | 0.3 /100 | #257 | Tragic 5.6% |
| Immigrants | Western Africa | 0.3 /100 | #258 | Tragic 5.6% |
| Sierra Leoneans | 0.2 /100 | #259 | Tragic 5.6% |
| Immigrants | Barbados | 0.2 /100 | #260 | Tragic 5.6% |
| South Americans | 0.2 /100 | #261 | Tragic 5.6% |
| Immigrants | St. Vincent and the Grenadines | 0.2 /100 | #262 | Tragic 5.6% |
| Immigrants | Jamaica | 0.2 /100 | #263 | Tragic 5.6% |
| Pueblo | 0.2 /100 | #264 | Tragic 5.6% |
| Jamaicans | 0.2 /100 | #265 | Tragic 5.6% |
| French Canadians | 0.2 /100 | #266 | Tragic 5.6% |
| Guyanese | 0.2 /100 | #267 | Tragic 5.6% |
| Hawaiians | 0.2 /100 | #268 | Tragic 5.7% |
| Immigrants | Colombia | 0.1 /100 | #269 | Tragic 5.7% |
| Immigrants | Nigeria | 0.1 /100 | #270 | Tragic 5.7% |
Demographics Similar to Sub-Saharan Africans by Unemployment Among Ages 65 to 74 years
In terms of unemployment among ages 65 to 74 years, the demographic groups most similar to Sub-Saharan Africans are Argentinean (5.4%, a difference of 0.0%), Seminole (5.4%, a difference of 0.0%), Icelander (5.4%, a difference of 0.010%), Immigrants from Western Asia (5.4%, a difference of 0.030%), and Immigrants from Pakistan (5.4%, a difference of 0.060%).
| Demographics | Rating | Rank | Unemployment Among Ages 65 to 74 years |
| Immigrants | China | 24.2 /100 | #195 | Fair 5.4% |
| Costa Ricans | 21.1 /100 | #196 | Fair 5.4% |
| Colville | 20.4 /100 | #197 | Fair 5.4% |
| Albanians | 17.8 /100 | #198 | Poor 5.4% |
| Immigrants | Belgium | 16.2 /100 | #199 | Poor 5.4% |
| Immigrants | Pakistan | 15.2 /100 | #200 | Poor 5.4% |
| Immigrants | Western Asia | 14.9 /100 | #201 | Poor 5.4% |
| Sub-Saharan Africans | 14.4 /100 | #202 | Poor 5.4% |
| Argentineans | 14.3 /100 | #203 | Poor 5.4% |
| Seminole | 14.3 /100 | #204 | Poor 5.4% |
| Icelanders | 14.2 /100 | #205 | Poor 5.4% |
| Africans | 12.8 /100 | #206 | Poor 5.5% |
| Immigrants | Uzbekistan | 12.5 /100 | #207 | Poor 5.5% |
| Dutch West Indians | 11.5 /100 | #208 | Poor 5.5% |
| Immigrants | Honduras | 10.4 /100 | #209 | Poor 5.5% |