Immigrants from Italy vs Yup'ik Unemployment Among Ages 16 to 19 years
COMPARE
Immigrants from Italy
Yup'ik
Unemployment Among Ages 16 to 19 years
Unemployment Among Ages 16 to 19 years Comparison
Immigrants from Italy
Yup'ik
17.5%
UNEMPLOYMENT AMONG AGES 16 TO 19 YEARS
55.2/ 100
METRIC RATING
166th/ 347
METRIC RANK
41.0%
UNEMPLOYMENT AMONG AGES 16 TO 19 YEARS
0.0/ 100
METRIC RATING
347th/ 347
METRIC RANK
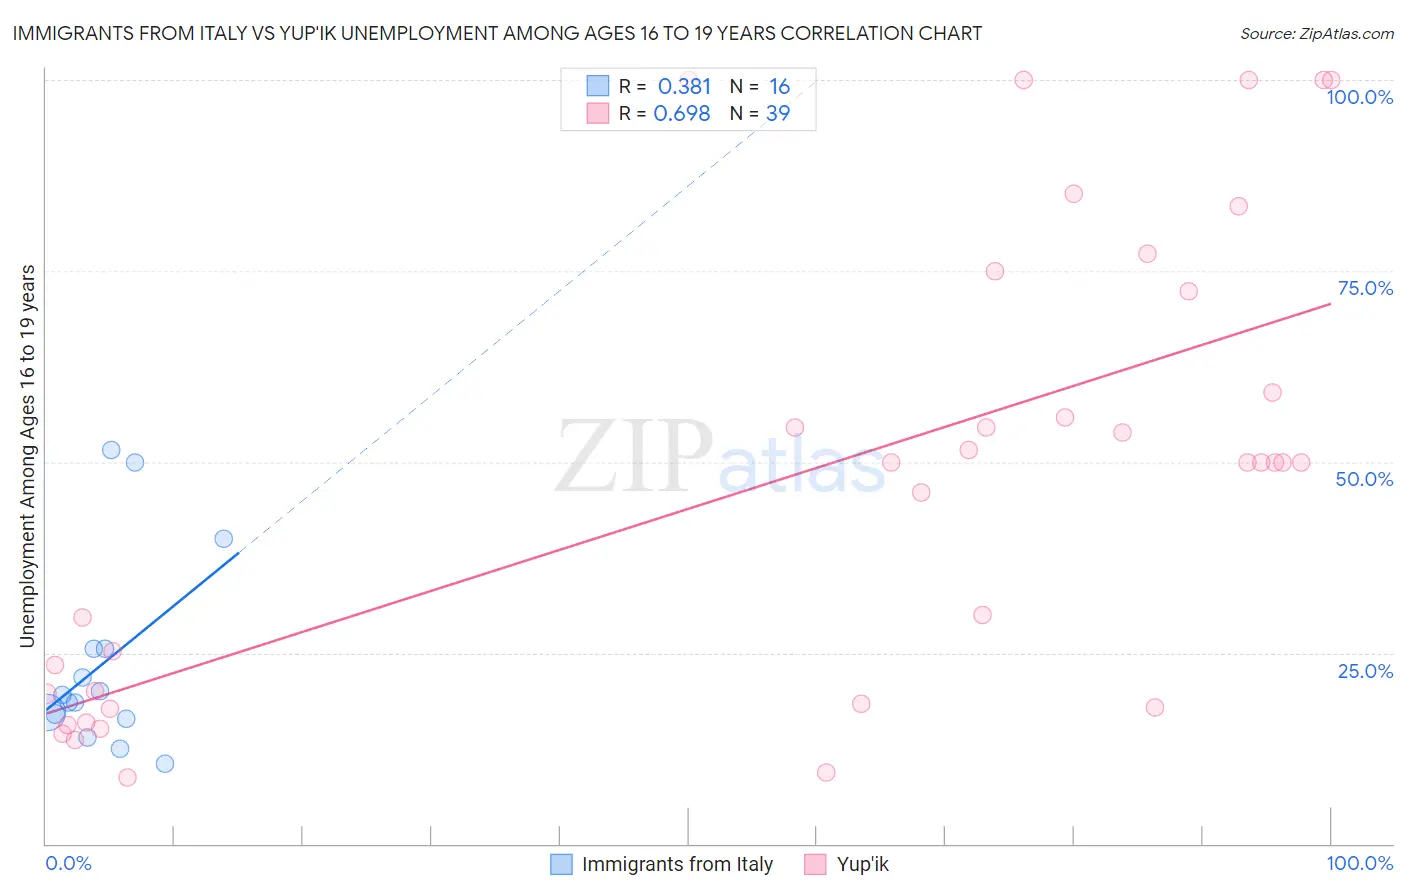
Immigrants from Italy vs Yup'ik Unemployment Among Ages 16 to 19 years Correlation Chart
The statistical analysis conducted on geographies consisting of 308,031,907 people shows a mild positive correlation between the proportion of Immigrants from Italy and unemployment rate among population between the ages 16 and 19 in the United States with a correlation coefficient (R) of 0.381 and weighted average of 17.5%. Similarly, the statistical analysis conducted on geographies consisting of 39,366,389 people shows a significant positive correlation between the proportion of Yup'ik and unemployment rate among population between the ages 16 and 19 in the United States with a correlation coefficient (R) of 0.698 and weighted average of 41.0%, a difference of 133.7%.
Unemployment Among Ages 16 to 19 years Correlation Summary
| Measurement | Immigrants from Italy | Yup'ik |
| Minimum | 10.5% | 8.7% |
| Maximum | 51.6% | 100.0% |
| Range | 41.1% | 91.3% |
| Mean | 23.6% | 47.8% |
| Median | 19.0% | 50.0% |
| Interquartile 25% (IQ1) | 16.7% | 18.4% |
| Interquartile 75% (IQ3) | 25.5% | 72.3% |
| Interquartile Range (IQR) | 8.9% | 53.9% |
| Standard Deviation (Sample) | 12.6% | 29.6% |
| Standard Deviation (Population) | 12.2% | 29.2% |
Similar Demographics by Unemployment Among Ages 16 to 19 years
Demographics Similar to Immigrants from Italy by Unemployment Among Ages 16 to 19 years
In terms of unemployment among ages 16 to 19 years, the demographic groups most similar to Immigrants from Italy are Immigrants from France (17.5%, a difference of 0.020%), Immigrants from Hungary (17.5%, a difference of 0.020%), Cape Verdean (17.5%, a difference of 0.030%), Immigrants from Cambodia (17.5%, a difference of 0.040%), and Immigrants from Romania (17.5%, a difference of 0.090%).
| Demographics | Rating | Rank | Unemployment Among Ages 16 to 19 years |
| Koreans | 61.0 /100 | #159 | Good 17.5% |
| Ukrainians | 60.5 /100 | #160 | Good 17.5% |
| Immigrants | Denmark | 60.3 /100 | #161 | Good 17.5% |
| Immigrants | Norway | 59.8 /100 | #162 | Average 17.5% |
| Egyptians | 59.7 /100 | #163 | Average 17.5% |
| Immigrants | Austria | 57.7 /100 | #164 | Average 17.5% |
| Cape Verdeans | 55.8 /100 | #165 | Average 17.5% |
| Immigrants | Italy | 55.2 /100 | #166 | Average 17.5% |
| Immigrants | France | 54.9 /100 | #167 | Average 17.5% |
| Immigrants | Hungary | 54.7 /100 | #168 | Average 17.5% |
| Immigrants | Cambodia | 54.5 /100 | #169 | Average 17.5% |
| Immigrants | Romania | 53.3 /100 | #170 | Average 17.5% |
| Immigrants | Switzerland | 53.2 /100 | #171 | Average 17.5% |
| Immigrants | Western Europe | 52.2 /100 | #172 | Average 17.6% |
| Chileans | 50.8 /100 | #173 | Average 17.6% |
Demographics Similar to Yup'ik by Unemployment Among Ages 16 to 19 years
In terms of unemployment among ages 16 to 19 years, the demographic groups most similar to Yup'ik are Yuman (37.4%, a difference of 9.5%), Hopi (30.7%, a difference of 33.6%), Colville (29.7%, a difference of 38.1%), Navajo (29.0%, a difference of 41.1%), and Inupiat (28.1%, a difference of 46.0%).
| Demographics | Rating | Rank | Unemployment Among Ages 16 to 19 years |
| Paiute | 0.0 /100 | #333 | Tragic 24.4% |
| Guyanese | 0.0 /100 | #334 | Tragic 24.8% |
| Arapaho | 0.0 /100 | #335 | Tragic 25.2% |
| Kiowa | 0.0 /100 | #336 | Tragic 25.2% |
| Immigrants | Guyana | 0.0 /100 | #337 | Tragic 25.5% |
| Immigrants | St. Vincent and the Grenadines | 0.0 /100 | #338 | Tragic 25.7% |
| Immigrants | Grenada | 0.0 /100 | #339 | Tragic 25.7% |
| Crow | 0.0 /100 | #340 | Tragic 26.2% |
| Puerto Ricans | 0.0 /100 | #341 | Tragic 27.5% |
| Inupiat | 0.0 /100 | #342 | Tragic 28.1% |
| Navajo | 0.0 /100 | #343 | Tragic 29.0% |
| Colville | 0.0 /100 | #344 | Tragic 29.7% |
| Hopi | 0.0 /100 | #345 | Tragic 30.7% |
| Yuman | 0.0 /100 | #346 | Tragic 37.4% |
| Yup'ik | 0.0 /100 | #347 | Tragic 41.0% |