Immigrants from Israel vs White/Caucasian Male Unemployment
COMPARE
Immigrants from Israel
White/Caucasian
Male Unemployment
Male Unemployment Comparison
Immigrants from Israel
Whites/Caucasians
5.4%
MALE UNEMPLOYMENT
25.2/ 100
METRIC RATING
193rd/ 347
METRIC RANK
5.0%
MALE UNEMPLOYMENT
97.3/ 100
METRIC RATING
70th/ 347
METRIC RANK
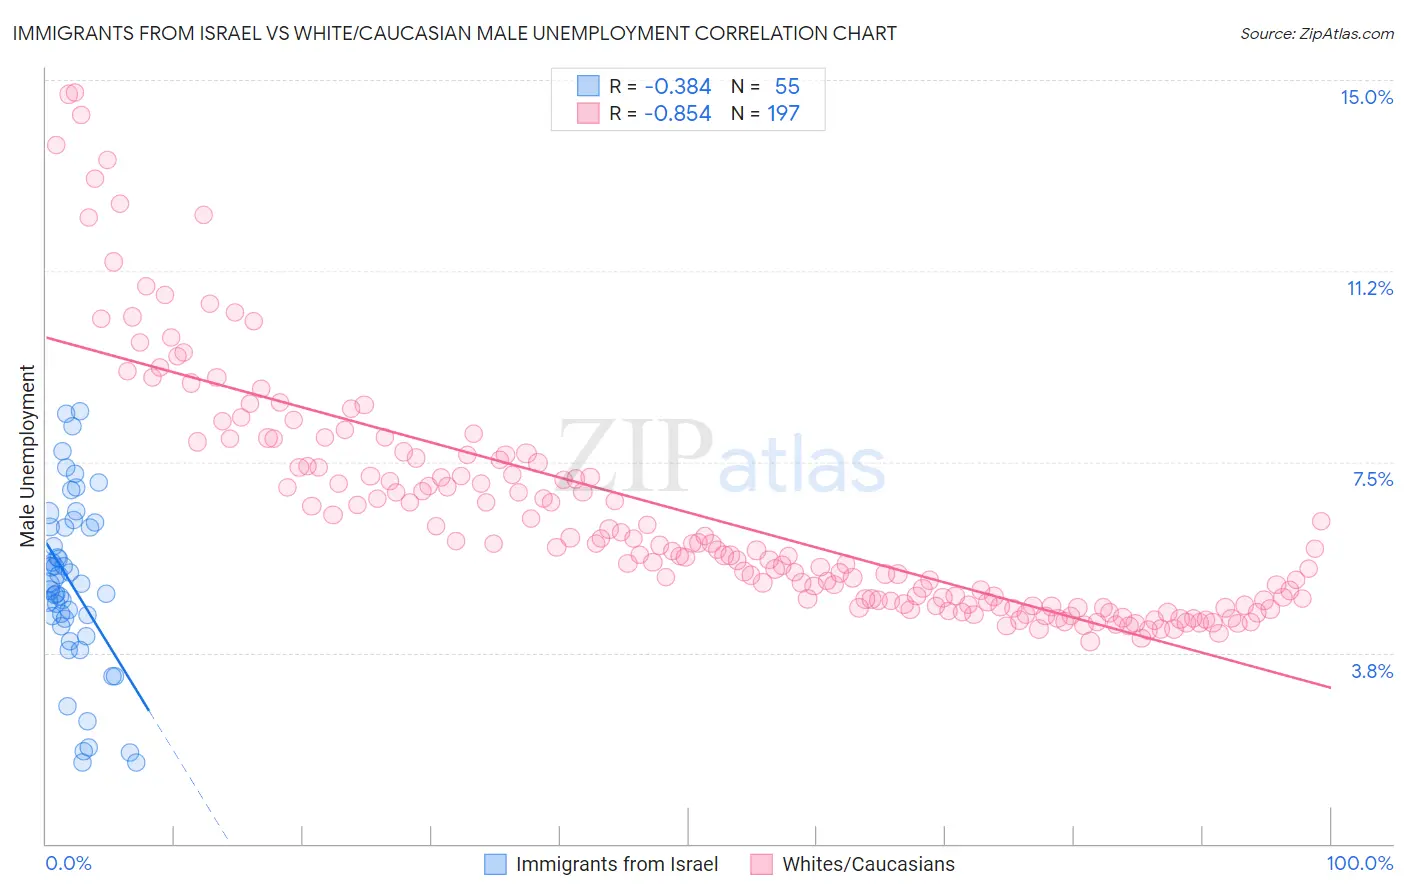
Immigrants from Israel vs White/Caucasian Male Unemployment Correlation Chart
The statistical analysis conducted on geographies consisting of 209,695,257 people shows a mild negative correlation between the proportion of Immigrants from Israel and unemployment rate among males in the United States with a correlation coefficient (R) of -0.384 and weighted average of 5.4%. Similarly, the statistical analysis conducted on geographies consisting of 569,852,701 people shows a very strong negative correlation between the proportion of Whites/Caucasians and unemployment rate among males in the United States with a correlation coefficient (R) of -0.854 and weighted average of 5.0%, a difference of 7.2%.
Male Unemployment Correlation Summary
| Measurement | Immigrants from Israel | White/Caucasian |
| Minimum | 1.6% | 4.0% |
| Maximum | 8.5% | 14.7% |
| Range | 6.9% | 10.8% |
| Mean | 5.1% | 6.5% |
| Median | 5.1% | 5.8% |
| Interquartile 25% (IQ1) | 4.3% | 4.7% |
| Interquartile 75% (IQ3) | 6.2% | 7.4% |
| Interquartile Range (IQR) | 2.0% | 2.7% |
| Standard Deviation (Sample) | 1.7% | 2.3% |
| Standard Deviation (Population) | 1.7% | 2.3% |
Similar Demographics by Male Unemployment
Demographics Similar to Immigrants from Israel by Male Unemployment
In terms of male unemployment, the demographic groups most similar to Immigrants from Israel are Immigrants from Belarus (5.4%, a difference of 0.060%), Immigrants from South Eastern Asia (5.4%, a difference of 0.22%), Immigrants from Uganda (5.4%, a difference of 0.26%), Immigrants from South America (5.4%, a difference of 0.30%), and Arab (5.4%, a difference of 0.36%).
| Demographics | Rating | Rank | Male Unemployment |
| Iraqis | 31.6 /100 | #186 | Fair 5.4% |
| Costa Ricans | 31.3 /100 | #187 | Fair 5.4% |
| Arabs | 30.2 /100 | #188 | Fair 5.4% |
| Immigrants | South America | 29.4 /100 | #189 | Fair 5.4% |
| Immigrants | Uganda | 28.8 /100 | #190 | Fair 5.4% |
| Immigrants | South Eastern Asia | 28.2 /100 | #191 | Fair 5.4% |
| Immigrants | Belarus | 26.0 /100 | #192 | Fair 5.4% |
| Immigrants | Israel | 25.2 /100 | #193 | Fair 5.4% |
| Spanish | 19.7 /100 | #194 | Poor 5.4% |
| Immigrants | Southern Europe | 17.7 /100 | #195 | Poor 5.4% |
| Albanians | 17.3 /100 | #196 | Poor 5.4% |
| Alsatians | 16.7 /100 | #197 | Poor 5.4% |
| Immigrants | Thailand | 14.7 /100 | #198 | Poor 5.4% |
| Immigrants | Greece | 14.5 /100 | #199 | Poor 5.4% |
| Immigrants | Zaire | 13.7 /100 | #200 | Poor 5.4% |
Demographics Similar to Whites/Caucasians by Male Unemployment
In terms of male unemployment, the demographic groups most similar to Whites/Caucasians are New Zealander (5.0%, a difference of 0.020%), Immigrants from Sweden (5.0%, a difference of 0.050%), Australian (5.0%, a difference of 0.080%), Immigrants from Canada (5.0%, a difference of 0.090%), and Immigrants from South Africa (5.0%, a difference of 0.090%).
| Demographics | Rating | Rank | Male Unemployment |
| Eastern Europeans | 97.9 /100 | #63 | Exceptional 5.0% |
| Celtics | 97.8 /100 | #64 | Exceptional 5.0% |
| Icelanders | 97.6 /100 | #65 | Exceptional 5.0% |
| Finns | 97.5 /100 | #66 | Exceptional 5.0% |
| Immigrants | Canada | 97.5 /100 | #67 | Exceptional 5.0% |
| Australians | 97.4 /100 | #68 | Exceptional 5.0% |
| Immigrants | Sweden | 97.4 /100 | #69 | Exceptional 5.0% |
| Whites/Caucasians | 97.3 /100 | #70 | Exceptional 5.0% |
| New Zealanders | 97.3 /100 | #71 | Exceptional 5.0% |
| Immigrants | South Africa | 97.1 /100 | #72 | Exceptional 5.0% |
| Greeks | 97.0 /100 | #73 | Exceptional 5.0% |
| Immigrants | North America | 96.9 /100 | #74 | Exceptional 5.0% |
| Assyrians/Chaldeans/Syriacs | 96.9 /100 | #75 | Exceptional 5.0% |
| Immigrants | Sudan | 96.5 /100 | #76 | Exceptional 5.0% |
| Iranians | 96.4 /100 | #77 | Exceptional 5.0% |