Immigrants from Ireland vs New Zealander Unemployment Among Ages 30 to 34 years
COMPARE
Immigrants from Ireland
New Zealander
Unemployment Among Ages 30 to 34 years
Unemployment Among Ages 30 to 34 years Comparison
Immigrants from Ireland
New Zealanders
5.2%
UNEMPLOYMENT AMONG AGES 30 TO 34 YEARS
90.6/ 100
METRIC RATING
99th/ 347
METRIC RANK
5.3%
UNEMPLOYMENT AMONG AGES 30 TO 34 YEARS
82.5/ 100
METRIC RATING
119th/ 347
METRIC RANK
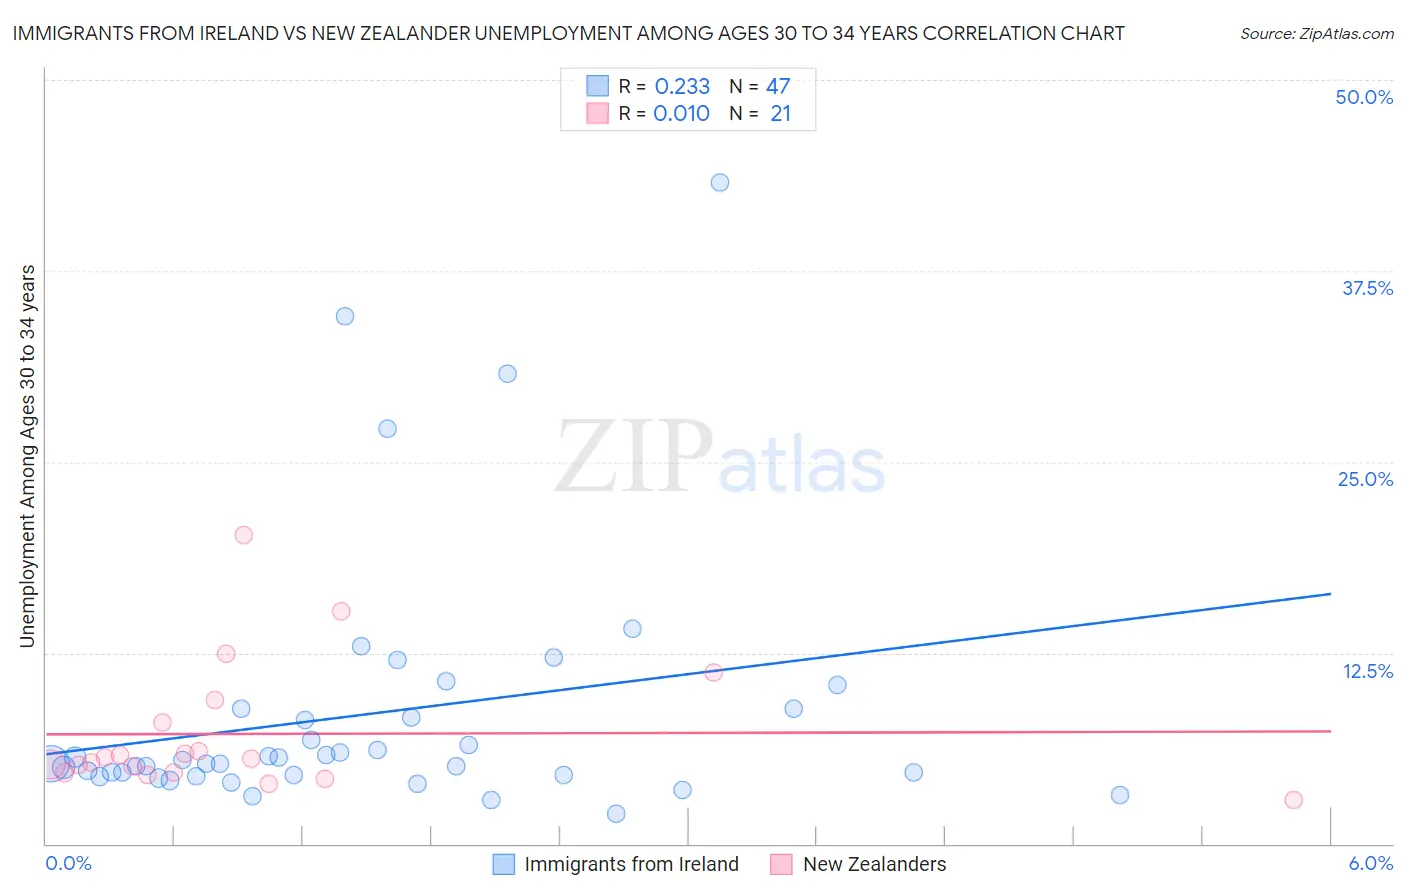
Immigrants from Ireland vs New Zealander Unemployment Among Ages 30 to 34 years Correlation Chart
The statistical analysis conducted on geographies consisting of 230,437,728 people shows a weak positive correlation between the proportion of Immigrants from Ireland and unemployment rate among population between the ages 30 and 34 in the United States with a correlation coefficient (R) of 0.233 and weighted average of 5.2%. Similarly, the statistical analysis conducted on geographies consisting of 104,776,009 people shows no correlation between the proportion of New Zealanders and unemployment rate among population between the ages 30 and 34 in the United States with a correlation coefficient (R) of 0.010 and weighted average of 5.3%, a difference of 1.3%.
Unemployment Among Ages 30 to 34 years Correlation Summary
| Measurement | Immigrants from Ireland | New Zealander |
| Minimum | 2.0% | 2.9% |
| Maximum | 43.3% | 20.2% |
| Range | 41.3% | 17.3% |
| Mean | 8.5% | 7.2% |
| Median | 5.2% | 5.5% |
| Interquartile 25% (IQ1) | 4.5% | 4.6% |
| Interquartile 75% (IQ3) | 8.8% | 8.7% |
| Interquartile Range (IQR) | 4.3% | 4.0% |
| Standard Deviation (Sample) | 8.5% | 4.3% |
| Standard Deviation (Population) | 8.4% | 4.2% |
Demographics Similar to Immigrants from Ireland and New Zealanders by Unemployment Among Ages 30 to 34 years
In terms of unemployment among ages 30 to 34 years, the demographic groups most similar to Immigrants from Ireland are Immigrants from Czechoslovakia (5.3%, a difference of 0.21%), British (5.3%, a difference of 0.28%), Immigrants from Switzerland (5.3%, a difference of 0.34%), Immigrants from Jordan (5.3%, a difference of 0.35%), and Northern European (5.3%, a difference of 0.51%). Similarly, the demographic groups most similar to New Zealanders are Immigrants from South Africa (5.3%, a difference of 0.060%), Australian (5.3%, a difference of 0.070%), Eastern European (5.3%, a difference of 0.080%), Immigrants from Albania (5.3%, a difference of 0.11%), and Estonian (5.3%, a difference of 0.15%).
| Demographics | Rating | Rank | Unemployment Among Ages 30 to 34 years |
| Immigrants | Ireland | 90.6 /100 | #99 | Exceptional 5.2% |
| Immigrants | Czechoslovakia | 89.5 /100 | #100 | Excellent 5.3% |
| British | 89.1 /100 | #101 | Excellent 5.3% |
| Immigrants | Switzerland | 88.8 /100 | #102 | Excellent 5.3% |
| Immigrants | Jordan | 88.8 /100 | #103 | Excellent 5.3% |
| Northern Europeans | 87.9 /100 | #104 | Excellent 5.3% |
| Argentineans | 87.9 /100 | #105 | Excellent 5.3% |
| Croatians | 87.6 /100 | #106 | Excellent 5.3% |
| Icelanders | 87.2 /100 | #107 | Excellent 5.3% |
| Immigrants | Middle Africa | 87.1 /100 | #108 | Excellent 5.3% |
| Immigrants | Chile | 86.7 /100 | #109 | Excellent 5.3% |
| Egyptians | 86.4 /100 | #110 | Excellent 5.3% |
| Immigrants | Pakistan | 86.2 /100 | #111 | Excellent 5.3% |
| Swiss | 85.9 /100 | #112 | Excellent 5.3% |
| Immigrants | Spain | 85.6 /100 | #113 | Excellent 5.3% |
| Estonians | 83.7 /100 | #114 | Excellent 5.3% |
| Immigrants | Albania | 83.4 /100 | #115 | Excellent 5.3% |
| Eastern Europeans | 83.2 /100 | #116 | Excellent 5.3% |
| Australians | 83.1 /100 | #117 | Excellent 5.3% |
| Immigrants | South Africa | 83.0 /100 | #118 | Excellent 5.3% |
| New Zealanders | 82.5 /100 | #119 | Excellent 5.3% |