Immigrants from Ireland vs Marshallese Unemployment Among Ages 16 to 19 years
COMPARE
Immigrants from Ireland
Marshallese
Unemployment Among Ages 16 to 19 years
Unemployment Among Ages 16 to 19 years Comparison
Immigrants from Ireland
Marshallese
17.8%
UNEMPLOYMENT AMONG AGES 16 TO 19 YEARS
28.5/ 100
METRIC RATING
199th/ 347
METRIC RANK
17.6%
UNEMPLOYMENT AMONG AGES 16 TO 19 YEARS
41.7/ 100
METRIC RATING
190th/ 347
METRIC RANK
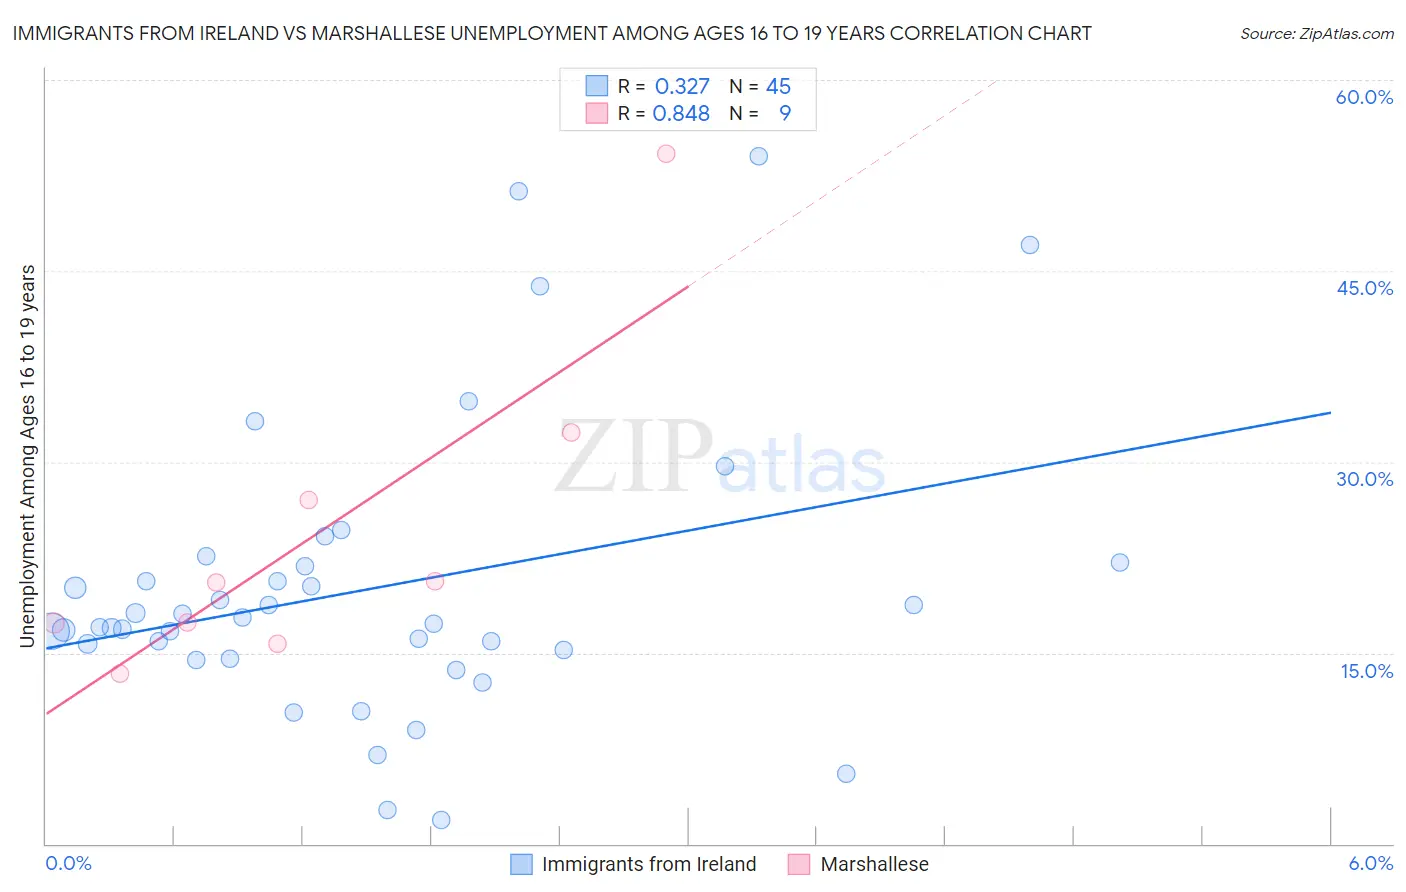
Immigrants from Ireland vs Marshallese Unemployment Among Ages 16 to 19 years Correlation Chart
The statistical analysis conducted on geographies consisting of 230,161,155 people shows a mild positive correlation between the proportion of Immigrants from Ireland and unemployment rate among population between the ages 16 and 19 in the United States with a correlation coefficient (R) of 0.327 and weighted average of 17.8%. Similarly, the statistical analysis conducted on geographies consisting of 14,627,426 people shows a very strong positive correlation between the proportion of Marshallese and unemployment rate among population between the ages 16 and 19 in the United States with a correlation coefficient (R) of 0.848 and weighted average of 17.6%, a difference of 0.68%.
Unemployment Among Ages 16 to 19 years Correlation Summary
| Measurement | Immigrants from Ireland | Marshallese |
| Minimum | 1.9% | 13.3% |
| Maximum | 54.0% | 54.2% |
| Range | 52.1% | 40.9% |
| Mean | 20.0% | 24.3% |
| Median | 17.3% | 20.5% |
| Interquartile 25% (IQ1) | 14.9% | 16.5% |
| Interquartile 75% (IQ3) | 21.9% | 29.6% |
| Interquartile Range (IQR) | 7.1% | 13.1% |
| Standard Deviation (Sample) | 11.3% | 12.7% |
| Standard Deviation (Population) | 11.2% | 11.9% |
Demographics Similar to Immigrants from Ireland and Marshallese by Unemployment Among Ages 16 to 19 years
In terms of unemployment among ages 16 to 19 years, the demographic groups most similar to Immigrants from Ireland are Immigrants from Fiji (17.8%, a difference of 0.050%), Ethiopian (17.8%, a difference of 0.060%), Immigrants from Czechoslovakia (17.8%, a difference of 0.070%), Immigrants from Ethiopia (17.8%, a difference of 0.070%), and Immigrants from Portugal (17.8%, a difference of 0.080%). Similarly, the demographic groups most similar to Marshallese are Immigrants from Europe (17.6%, a difference of 0.010%), Immigrants from Nicaragua (17.6%, a difference of 0.020%), Immigrants from Costa Rica (17.6%, a difference of 0.020%), Immigrants from Micronesia (17.6%, a difference of 0.030%), and Immigrants from Philippines (17.7%, a difference of 0.050%).
| Demographics | Rating | Rank | Unemployment Among Ages 16 to 19 years |
| Eastern Europeans | 44.3 /100 | #184 | Average 17.6% |
| Iroquois | 43.4 /100 | #185 | Average 17.6% |
| Japanese | 43.2 /100 | #186 | Average 17.6% |
| Immigrants | Micronesia | 42.4 /100 | #187 | Average 17.6% |
| Immigrants | Nicaragua | 42.2 /100 | #188 | Average 17.6% |
| Immigrants | Europe | 41.8 /100 | #189 | Average 17.6% |
| Marshallese | 41.7 /100 | #190 | Average 17.6% |
| Immigrants | Costa Rica | 41.3 /100 | #191 | Average 17.6% |
| Immigrants | Philippines | 40.7 /100 | #192 | Average 17.7% |
| Immigrants | Australia | 40.6 /100 | #193 | Average 17.7% |
| Peruvians | 38.8 /100 | #194 | Fair 17.7% |
| Immigrants | Peru | 37.3 /100 | #195 | Fair 17.7% |
| Alaskan Athabascans | 34.1 /100 | #196 | Fair 17.7% |
| Immigrants | Czechoslovakia | 29.8 /100 | #197 | Fair 17.8% |
| Ethiopians | 29.6 /100 | #198 | Fair 17.8% |
| Immigrants | Ireland | 28.5 /100 | #199 | Fair 17.8% |
| Immigrants | Fiji | 27.7 /100 | #200 | Fair 17.8% |
| Immigrants | Ethiopia | 27.4 /100 | #201 | Fair 17.8% |
| Immigrants | Portugal | 27.2 /100 | #202 | Fair 17.8% |
| Immigrants | Eastern Europe | 23.6 /100 | #203 | Fair 17.8% |
| Immigrants | Nonimmigrants | 20.9 /100 | #204 | Fair 17.9% |