Immigrants from Ireland vs Houma Unemployment Among Ages 55 to 59 years
COMPARE
Immigrants from Ireland
Houma
Unemployment Among Ages 55 to 59 years
Unemployment Among Ages 55 to 59 years Comparison
Immigrants from Ireland
Houma
5.0%
UNEMPLOYMENT AMONG AGES 55 TO 59 YEARS
4.8/ 100
METRIC RATING
223rd/ 347
METRIC RANK
5.6%
UNEMPLOYMENT AMONG AGES 55 TO 59 YEARS
0.0/ 100
METRIC RATING
311th/ 347
METRIC RANK
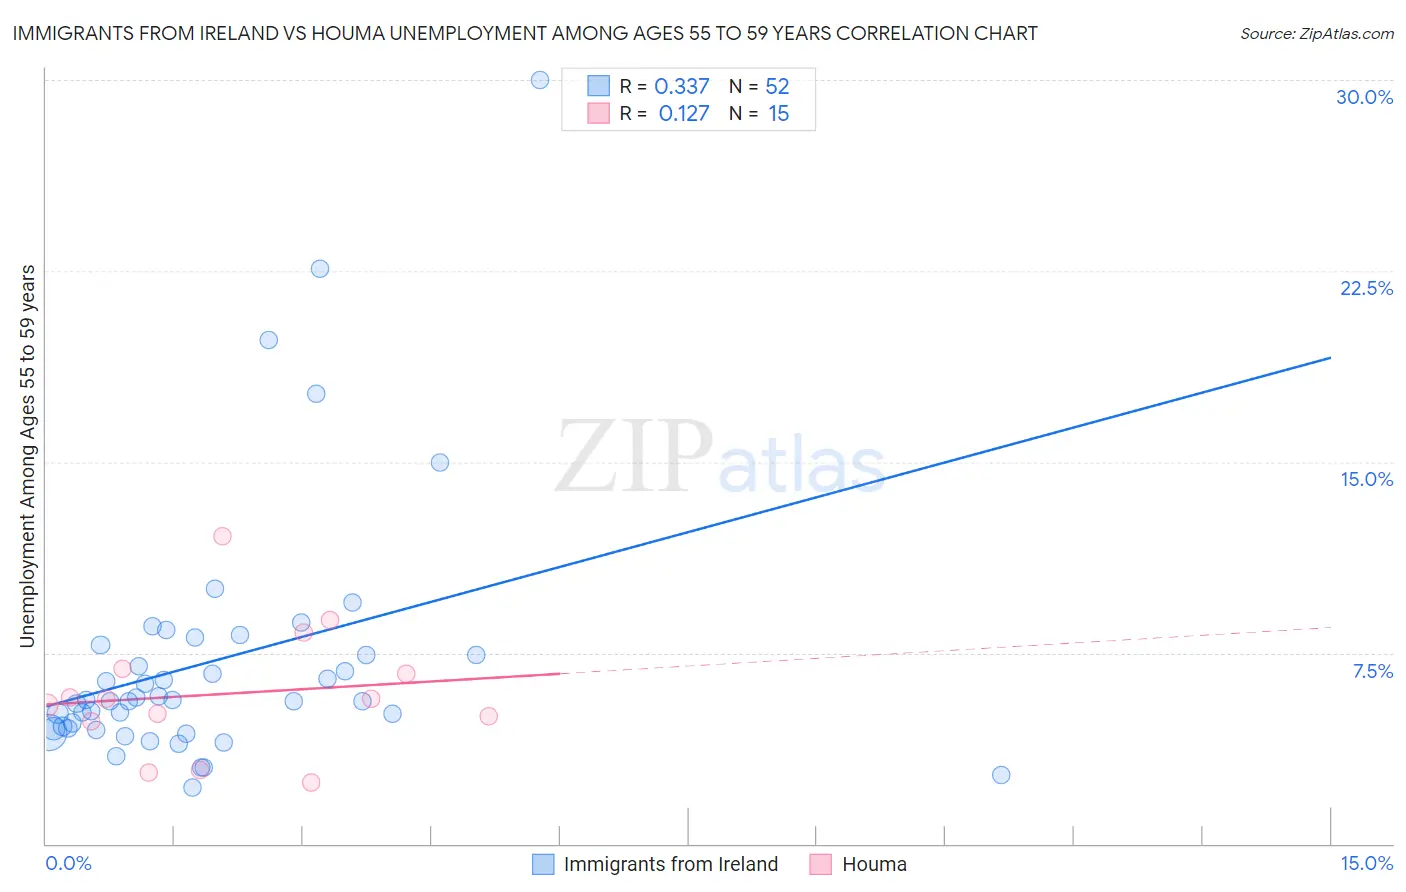
Immigrants from Ireland vs Houma Unemployment Among Ages 55 to 59 years Correlation Chart
The statistical analysis conducted on geographies consisting of 231,716,113 people shows a mild positive correlation between the proportion of Immigrants from Ireland and unemployment rate among population between the ages 55 and 59 in the United States with a correlation coefficient (R) of 0.337 and weighted average of 5.0%. Similarly, the statistical analysis conducted on geographies consisting of 35,803,241 people shows a poor positive correlation between the proportion of Houma and unemployment rate among population between the ages 55 and 59 in the United States with a correlation coefficient (R) of 0.127 and weighted average of 5.6%, a difference of 13.2%.
Unemployment Among Ages 55 to 59 years Correlation Summary
| Measurement | Immigrants from Ireland | Houma |
| Minimum | 2.2% | 2.4% |
| Maximum | 30.0% | 12.1% |
| Range | 27.8% | 9.7% |
| Mean | 7.2% | 5.9% |
| Median | 5.6% | 5.7% |
| Interquartile 25% (IQ1) | 4.5% | 4.8% |
| Interquartile 75% (IQ3) | 7.6% | 6.9% |
| Interquartile Range (IQR) | 3.1% | 2.0% |
| Standard Deviation (Sample) | 5.1% | 2.5% |
| Standard Deviation (Population) | 5.1% | 2.4% |
Similar Demographics by Unemployment Among Ages 55 to 59 years
Demographics Similar to Immigrants from Ireland by Unemployment Among Ages 55 to 59 years
In terms of unemployment among ages 55 to 59 years, the demographic groups most similar to Immigrants from Ireland are Spanish (5.0%, a difference of 0.070%), Subsaharan African (5.0%, a difference of 0.070%), Costa Rican (5.0%, a difference of 0.090%), Immigrants from China (5.0%, a difference of 0.13%), and Immigrants from Iran (5.0%, a difference of 0.26%).
| Demographics | Rating | Rank | Unemployment Among Ages 55 to 59 years |
| Spanish Americans | 8.1 /100 | #216 | Tragic 4.9% |
| Immigrants | Brazil | 8.1 /100 | #217 | Tragic 4.9% |
| Immigrants | Austria | 8.0 /100 | #218 | Tragic 4.9% |
| Immigrants | Nigeria | 8.0 /100 | #219 | Tragic 4.9% |
| Indians (Asian) | 7.6 /100 | #220 | Tragic 4.9% |
| Nigerians | 7.5 /100 | #221 | Tragic 4.9% |
| Spanish | 5.1 /100 | #222 | Tragic 5.0% |
| Immigrants | Ireland | 4.8 /100 | #223 | Tragic 5.0% |
| Sub-Saharan Africans | 4.4 /100 | #224 | Tragic 5.0% |
| Costa Ricans | 4.4 /100 | #225 | Tragic 5.0% |
| Immigrants | China | 4.2 /100 | #226 | Tragic 5.0% |
| Immigrants | Iran | 3.7 /100 | #227 | Tragic 5.0% |
| Immigrants | Liberia | 3.2 /100 | #228 | Tragic 5.0% |
| Immigrants | Western Asia | 3.0 /100 | #229 | Tragic 5.0% |
| Immigrants | Syria | 2.7 /100 | #230 | Tragic 5.0% |
Demographics Similar to Houma by Unemployment Among Ages 55 to 59 years
In terms of unemployment among ages 55 to 59 years, the demographic groups most similar to Houma are Belizean (5.6%, a difference of 0.18%), Ecuadorian (5.6%, a difference of 0.21%), Central American Indian (5.6%, a difference of 0.41%), Nepalese (5.6%, a difference of 0.62%), and Tlingit-Haida (5.7%, a difference of 0.69%).
| Demographics | Rating | Rank | Unemployment Among Ages 55 to 59 years |
| Blacks/African Americans | 0.0 /100 | #304 | Tragic 5.5% |
| Immigrants | Portugal | 0.0 /100 | #305 | Tragic 5.5% |
| Immigrants | Cabo Verde | 0.0 /100 | #306 | Tragic 5.5% |
| Immigrants | Belize | 0.0 /100 | #307 | Tragic 5.5% |
| Spanish American Indians | 0.0 /100 | #308 | Tragic 5.6% |
| Nepalese | 0.0 /100 | #309 | Tragic 5.6% |
| Belizeans | 0.0 /100 | #310 | Tragic 5.6% |
| Houma | 0.0 /100 | #311 | Tragic 5.6% |
| Ecuadorians | 0.0 /100 | #312 | Tragic 5.6% |
| Central American Indians | 0.0 /100 | #313 | Tragic 5.6% |
| Tlingit-Haida | 0.0 /100 | #314 | Tragic 5.7% |
| Guyanese | 0.0 /100 | #315 | Tragic 5.7% |
| Immigrants | Ecuador | 0.0 /100 | #316 | Tragic 5.7% |
| Hmong | 0.0 /100 | #317 | Tragic 5.7% |
| Immigrants | Guyana | 0.0 /100 | #318 | Tragic 5.8% |