Immigrants from Iraq vs Paraguayan Unemployment Among Ages 25 to 29 years
COMPARE
Immigrants from Iraq
Paraguayan
Unemployment Among Ages 25 to 29 years
Unemployment Among Ages 25 to 29 years Comparison
Immigrants from Iraq
Paraguayans
6.7%
UNEMPLOYMENT AMONG AGES 25 TO 29 YEARS
45.1/ 100
METRIC RATING
178th/ 347
METRIC RANK
6.6%
UNEMPLOYMENT AMONG AGES 25 TO 29 YEARS
60.4/ 100
METRIC RATING
161st/ 347
METRIC RANK
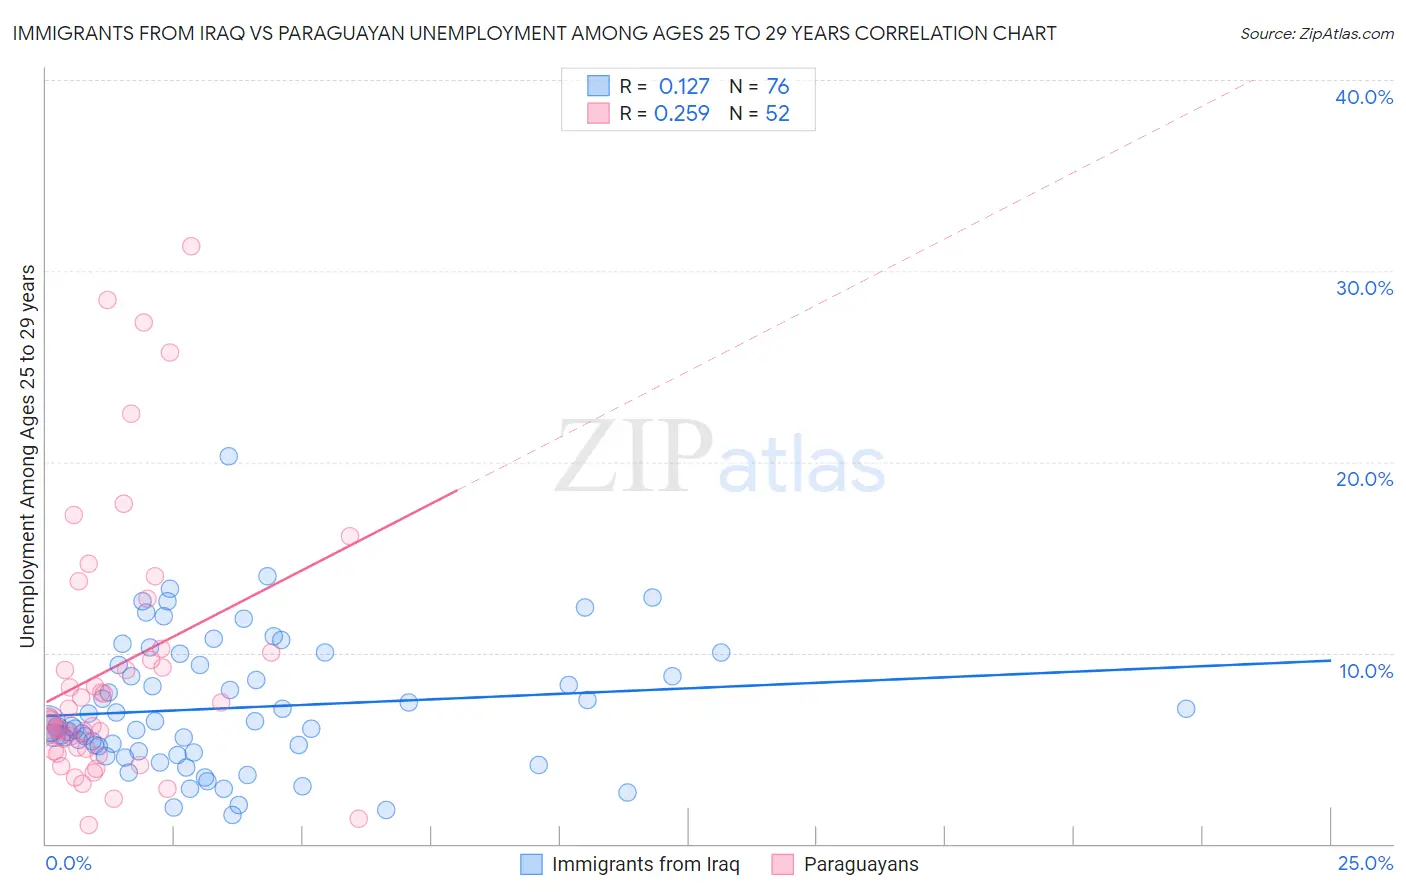
Immigrants from Iraq vs Paraguayan Unemployment Among Ages 25 to 29 years Correlation Chart
The statistical analysis conducted on geographies consisting of 191,113,274 people shows a poor positive correlation between the proportion of Immigrants from Iraq and unemployment rate among population between the ages 25 and 29 in the United States with a correlation coefficient (R) of 0.127 and weighted average of 6.7%. Similarly, the statistical analysis conducted on geographies consisting of 93,862,342 people shows a weak positive correlation between the proportion of Paraguayans and unemployment rate among population between the ages 25 and 29 in the United States with a correlation coefficient (R) of 0.259 and weighted average of 6.6%, a difference of 0.96%.
Unemployment Among Ages 25 to 29 years Correlation Summary
| Measurement | Immigrants from Iraq | Paraguayan |
| Minimum | 1.5% | 1.0% |
| Maximum | 20.3% | 31.3% |
| Range | 18.8% | 30.3% |
| Mean | 7.1% | 9.2% |
| Median | 6.1% | 6.5% |
| Interquartile 25% (IQ1) | 4.8% | 4.9% |
| Interquartile 75% (IQ3) | 9.3% | 10.1% |
| Interquartile Range (IQR) | 4.5% | 5.2% |
| Standard Deviation (Sample) | 3.5% | 7.1% |
| Standard Deviation (Population) | 3.4% | 7.0% |
Demographics Similar to Immigrants from Iraq and Paraguayans by Unemployment Among Ages 25 to 29 years
In terms of unemployment among ages 25 to 29 years, the demographic groups most similar to Immigrants from Iraq are Costa Rican (6.7%, a difference of 0.010%), Immigrants from Israel (6.7%, a difference of 0.16%), Osage (6.7%, a difference of 0.18%), Immigrants from South Eastern Asia (6.7%, a difference of 0.24%), and Immigrants from North America (6.6%, a difference of 0.30%). Similarly, the demographic groups most similar to Paraguayans are Scottish (6.6%, a difference of 0.020%), Immigrants from Czechoslovakia (6.6%, a difference of 0.020%), Welsh (6.6%, a difference of 0.060%), Immigrants from Middle Africa (6.6%, a difference of 0.070%), and Greek (6.6%, a difference of 0.12%).
| Demographics | Rating | Rank | Unemployment Among Ages 25 to 29 years |
| Welsh | 61.3 /100 | #159 | Good 6.6% |
| Scottish | 60.7 /100 | #160 | Good 6.6% |
| Paraguayans | 60.4 /100 | #161 | Good 6.6% |
| Immigrants | Czechoslovakia | 60.2 /100 | #162 | Good 6.6% |
| Immigrants | Middle Africa | 59.4 /100 | #163 | Average 6.6% |
| Greeks | 58.5 /100 | #164 | Average 6.6% |
| English | 58.0 /100 | #165 | Average 6.6% |
| Immigrants | Northern Europe | 57.3 /100 | #166 | Average 6.6% |
| Immigrants | Canada | 55.0 /100 | #167 | Average 6.6% |
| Estonians | 54.8 /100 | #168 | Average 6.6% |
| South Americans | 54.5 /100 | #169 | Average 6.6% |
| Albanians | 53.5 /100 | #170 | Average 6.6% |
| Immigrants | Cambodia | 52.6 /100 | #171 | Average 6.6% |
| Bangladeshis | 51.6 /100 | #172 | Average 6.6% |
| Russians | 51.3 /100 | #173 | Average 6.6% |
| Immigrants | North America | 50.0 /100 | #174 | Average 6.6% |
| Immigrants | South Eastern Asia | 49.1 /100 | #175 | Average 6.7% |
| Osage | 48.1 /100 | #176 | Average 6.7% |
| Immigrants | Israel | 47.8 /100 | #177 | Average 6.7% |
| Immigrants | Iraq | 45.1 /100 | #178 | Average 6.7% |
| Costa Ricans | 44.9 /100 | #179 | Average 6.7% |