Immigrants from Iran vs Soviet Union Unemployment Among Women with Children Under 18 years
COMPARE
Immigrants from Iran
Soviet Union
Unemployment Among Women with Children Under 18 years
Unemployment Among Women with Children Under 18 years Comparison
Immigrants from Iran
Soviet Union
5.4%
UNEMPLOYMENT AMONG WOMEN WITH CHILDREN UNDER 18 YEARS
71.1/ 100
METRIC RATING
151st/ 347
METRIC RANK
4.9%
UNEMPLOYMENT AMONG WOMEN WITH CHILDREN UNDER 18 YEARS
99.5/ 100
METRIC RATING
27th/ 347
METRIC RANK
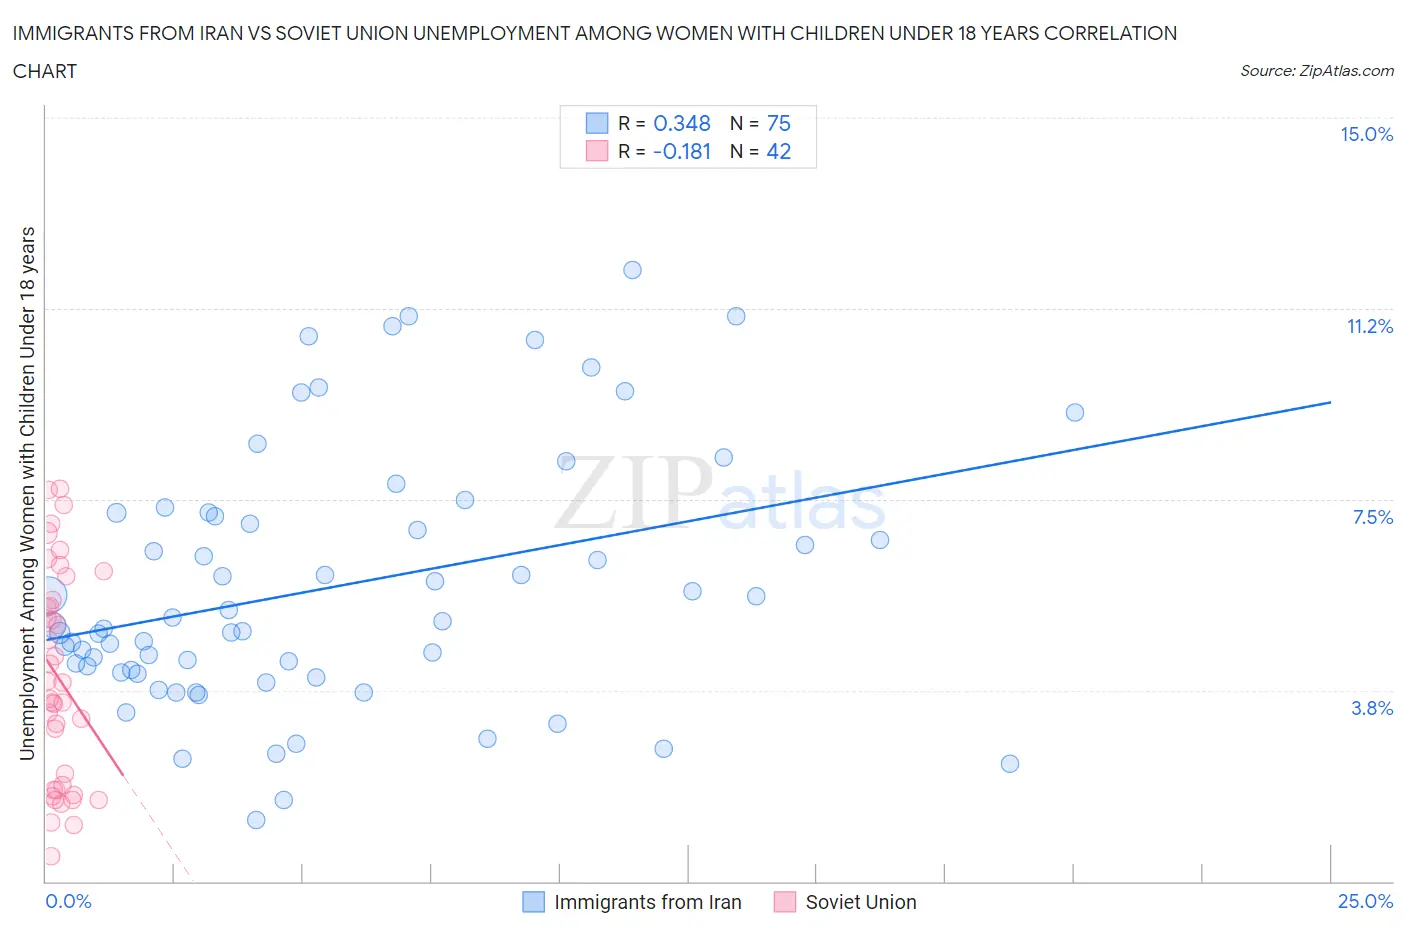
Immigrants from Iran vs Soviet Union Unemployment Among Women with Children Under 18 years Correlation Chart
The statistical analysis conducted on geographies consisting of 272,933,187 people shows a mild positive correlation between the proportion of Immigrants from Iran and unemployment rate among women with children under the age of 18 in the United States with a correlation coefficient (R) of 0.348 and weighted average of 5.4%. Similarly, the statistical analysis conducted on geographies consisting of 43,276,726 people shows a poor negative correlation between the proportion of Soviet Union and unemployment rate among women with children under the age of 18 in the United States with a correlation coefficient (R) of -0.181 and weighted average of 4.9%, a difference of 8.6%.
Unemployment Among Women with Children Under 18 years Correlation Summary
| Measurement | Immigrants from Iran | Soviet Union |
| Minimum | 1.2% | 0.50% |
| Maximum | 12.0% | 7.7% |
| Range | 10.8% | 7.2% |
| Mean | 5.8% | 4.0% |
| Median | 5.0% | 3.7% |
| Interquartile 25% (IQ1) | 4.1% | 1.8% |
| Interquartile 75% (IQ3) | 7.2% | 5.5% |
| Interquartile Range (IQR) | 3.1% | 3.7% |
| Standard Deviation (Sample) | 2.5% | 2.1% |
| Standard Deviation (Population) | 2.5% | 2.0% |
Similar Demographics by Unemployment Among Women with Children Under 18 years
Demographics Similar to Immigrants from Iran by Unemployment Among Women with Children Under 18 years
In terms of unemployment among women with children under 18 years, the demographic groups most similar to Immigrants from Iran are Immigrants from South Eastern Asia (5.4%, a difference of 0.010%), Carpatho Rusyn (5.4%, a difference of 0.030%), Immigrants from Latvia (5.4%, a difference of 0.030%), Immigrants from Argentina (5.4%, a difference of 0.050%), and Korean (5.4%, a difference of 0.050%).
| Demographics | Rating | Rank | Unemployment Among Women with Children Under 18 years |
| Immigrants | England | 74.9 /100 | #144 | Good 5.3% |
| Immigrants | Egypt | 74.0 /100 | #145 | Good 5.3% |
| Immigrants | Belarus | 73.4 /100 | #146 | Good 5.3% |
| Bangladeshis | 73.2 /100 | #147 | Good 5.3% |
| Immigrants | Western Europe | 72.8 /100 | #148 | Good 5.4% |
| Immigrants | Kenya | 72.2 /100 | #149 | Good 5.4% |
| Immigrants | Argentina | 71.7 /100 | #150 | Good 5.4% |
| Immigrants | Iran | 71.1 /100 | #151 | Good 5.4% |
| Immigrants | South Eastern Asia | 71.1 /100 | #152 | Good 5.4% |
| Carpatho Rusyns | 70.8 /100 | #153 | Good 5.4% |
| Immigrants | Latvia | 70.8 /100 | #154 | Good 5.4% |
| Koreans | 70.5 /100 | #155 | Good 5.4% |
| South Africans | 70.3 /100 | #156 | Good 5.4% |
| German Russians | 70.2 /100 | #157 | Good 5.4% |
| Immigrants | Burma/Myanmar | 69.5 /100 | #158 | Good 5.4% |
Demographics Similar to Soviet Union by Unemployment Among Women with Children Under 18 years
In terms of unemployment among women with children under 18 years, the demographic groups most similar to Soviet Union are Swiss (4.9%, a difference of 0.080%), Immigrants from Eastern Asia (4.9%, a difference of 0.16%), Chinese (4.9%, a difference of 0.18%), Belgian (4.9%, a difference of 0.19%), and Finnish (4.9%, a difference of 0.21%).
| Demographics | Rating | Rank | Unemployment Among Women with Children Under 18 years |
| Latvians | 99.7 /100 | #20 | Exceptional 4.9% |
| Europeans | 99.6 /100 | #21 | Exceptional 4.9% |
| Indians (Asian) | 99.6 /100 | #22 | Exceptional 4.9% |
| Immigrants | China | 99.6 /100 | #23 | Exceptional 4.9% |
| Belgians | 99.5 /100 | #24 | Exceptional 4.9% |
| Chinese | 99.5 /100 | #25 | Exceptional 4.9% |
| Swiss | 99.5 /100 | #26 | Exceptional 4.9% |
| Soviet Union | 99.5 /100 | #27 | Exceptional 4.9% |
| Immigrants | Eastern Asia | 99.5 /100 | #28 | Exceptional 4.9% |
| Finns | 99.4 /100 | #29 | Exceptional 4.9% |
| Burmese | 99.4 /100 | #30 | Exceptional 4.9% |
| Cypriots | 99.3 /100 | #31 | Exceptional 5.0% |
| Dutch | 99.3 /100 | #32 | Exceptional 5.0% |
| Croatians | 99.3 /100 | #33 | Exceptional 5.0% |
| Immigrants | South Central Asia | 99.2 /100 | #34 | Exceptional 5.0% |