Immigrants from Iran vs Immigrants from Yemen Male Unemployment
COMPARE
Immigrants from Iran
Immigrants from Yemen
Male Unemployment
Male Unemployment Comparison
Immigrants from Iran
Immigrants from Yemen
5.3%
MALE UNEMPLOYMENT
50.0/ 100
METRIC RATING
174th/ 347
METRIC RANK
7.8%
MALE UNEMPLOYMENT
0.0/ 100
METRIC RATING
329th/ 347
METRIC RANK
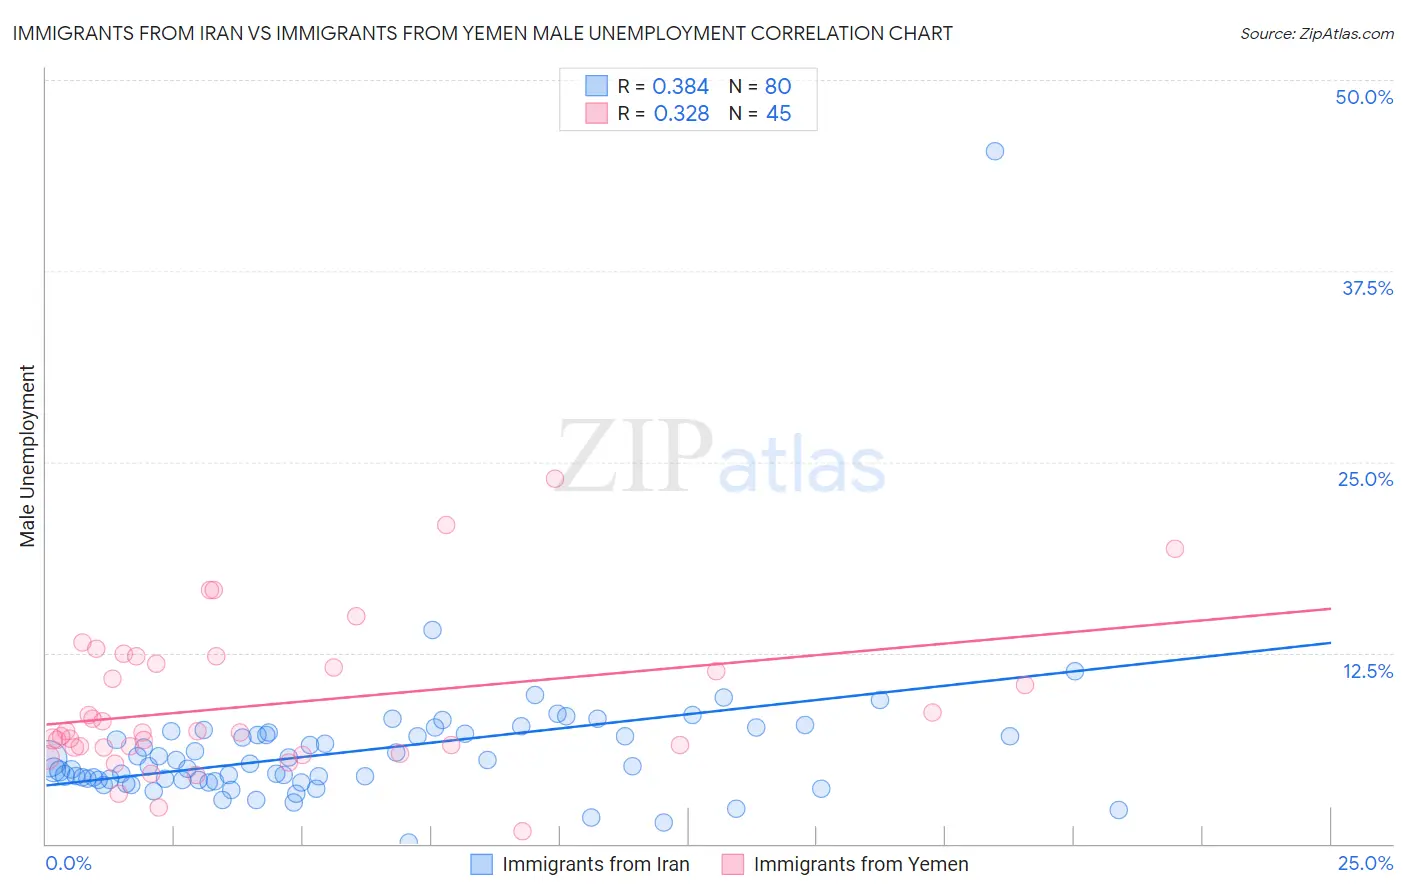
Immigrants from Iran vs Immigrants from Yemen Male Unemployment Correlation Chart
The statistical analysis conducted on geographies consisting of 279,526,020 people shows a mild positive correlation between the proportion of Immigrants from Iran and unemployment rate among males in the United States with a correlation coefficient (R) of 0.384 and weighted average of 5.3%. Similarly, the statistical analysis conducted on geographies consisting of 82,399,512 people shows a mild positive correlation between the proportion of Immigrants from Yemen and unemployment rate among males in the United States with a correlation coefficient (R) of 0.328 and weighted average of 7.8%, a difference of 47.1%.
Male Unemployment Correlation Summary
| Measurement | Immigrants from Iran | Immigrants from Yemen |
| Minimum | 0.10% | 0.80% |
| Maximum | 45.3% | 23.9% |
| Range | 45.2% | 23.1% |
| Mean | 6.1% | 9.1% |
| Median | 5.1% | 7.3% |
| Interquartile 25% (IQ1) | 4.2% | 6.3% |
| Interquartile 75% (IQ3) | 7.2% | 12.1% |
| Interquartile Range (IQR) | 3.0% | 5.7% |
| Standard Deviation (Sample) | 5.0% | 4.8% |
| Standard Deviation (Population) | 5.0% | 4.8% |
Similar Demographics by Male Unemployment
Demographics Similar to Immigrants from Iran by Male Unemployment
In terms of male unemployment, the demographic groups most similar to Immigrants from Iran are Immigrants from Russia (5.3%, a difference of 0.040%), Immigrants from Kazakhstan (5.3%, a difference of 0.050%), Peruvian (5.3%, a difference of 0.11%), Immigrants from Iraq (5.3%, a difference of 0.11%), and Immigrants from Poland (5.3%, a difference of 0.23%).
| Demographics | Rating | Rank | Male Unemployment |
| Immigrants | Vietnam | 58.1 /100 | #167 | Average 5.3% |
| Immigrants | Ireland | 57.7 /100 | #168 | Average 5.3% |
| Immigrants | Congo | 57.4 /100 | #169 | Average 5.3% |
| Immigrants | Eastern Europe | 54.1 /100 | #170 | Average 5.3% |
| Peruvians | 51.9 /100 | #171 | Average 5.3% |
| Immigrants | Kazakhstan | 50.8 /100 | #172 | Average 5.3% |
| Immigrants | Russia | 50.7 /100 | #173 | Average 5.3% |
| Immigrants | Iran | 50.0 /100 | #174 | Average 5.3% |
| Immigrants | Iraq | 48.1 /100 | #175 | Average 5.3% |
| Immigrants | Poland | 46.0 /100 | #176 | Average 5.3% |
| Immigrants | Peru | 44.6 /100 | #177 | Average 5.3% |
| Osage | 42.5 /100 | #178 | Average 5.3% |
| Immigrants | Oceania | 40.8 /100 | #179 | Average 5.3% |
| Malaysians | 39.6 /100 | #180 | Fair 5.3% |
| Immigrants | Afghanistan | 37.9 /100 | #181 | Fair 5.3% |
Demographics Similar to Immigrants from Yemen by Male Unemployment
In terms of male unemployment, the demographic groups most similar to Immigrants from Yemen are Native/Alaskan (7.7%, a difference of 0.90%), Paiute (7.7%, a difference of 1.3%), Yakama (7.9%, a difference of 1.8%), Immigrants from Dominican Republic (7.6%, a difference of 2.4%), and Shoshone (7.6%, a difference of 2.5%).
| Demographics | Rating | Rank | Male Unemployment |
| Immigrants | Cabo Verde | 0.0 /100 | #322 | Tragic 7.5% |
| Immigrants | Grenada | 0.0 /100 | #323 | Tragic 7.6% |
| Dominicans | 0.0 /100 | #324 | Tragic 7.6% |
| Shoshone | 0.0 /100 | #325 | Tragic 7.6% |
| Immigrants | Dominican Republic | 0.0 /100 | #326 | Tragic 7.6% |
| Paiute | 0.0 /100 | #327 | Tragic 7.7% |
| Natives/Alaskans | 0.0 /100 | #328 | Tragic 7.7% |
| Immigrants | Yemen | 0.0 /100 | #329 | Tragic 7.8% |
| Yakama | 0.0 /100 | #330 | Tragic 7.9% |
| Alaska Natives | 0.0 /100 | #331 | Tragic 8.1% |
| Pima | 0.0 /100 | #332 | Tragic 8.3% |
| Sioux | 0.0 /100 | #333 | Tragic 8.4% |
| Tsimshian | 0.0 /100 | #334 | Tragic 8.5% |
| Pueblo | 0.0 /100 | #335 | Tragic 8.5% |
| Yuman | 0.0 /100 | #336 | Tragic 8.6% |