Immigrants from Iran vs Immigrants from Costa Rica Unemployment Among Women with Children Ages 6 to 17 years
COMPARE
Immigrants from Iran
Immigrants from Costa Rica
Unemployment Among Women with Children Ages 6 to 17 years
Unemployment Among Women with Children Ages 6 to 17 years Comparison
Immigrants from Iran
Immigrants from Costa Rica
7.9%
UNEMPLOYMENT AMONG WOMEN WITH CHILDREN AGES 6 TO 17 YEARS
100.0/ 100
METRIC RATING
30th/ 347
METRIC RANK
9.0%
UNEMPLOYMENT AMONG WOMEN WITH CHILDREN AGES 6 TO 17 YEARS
50.0/ 100
METRIC RATING
174th/ 347
METRIC RANK
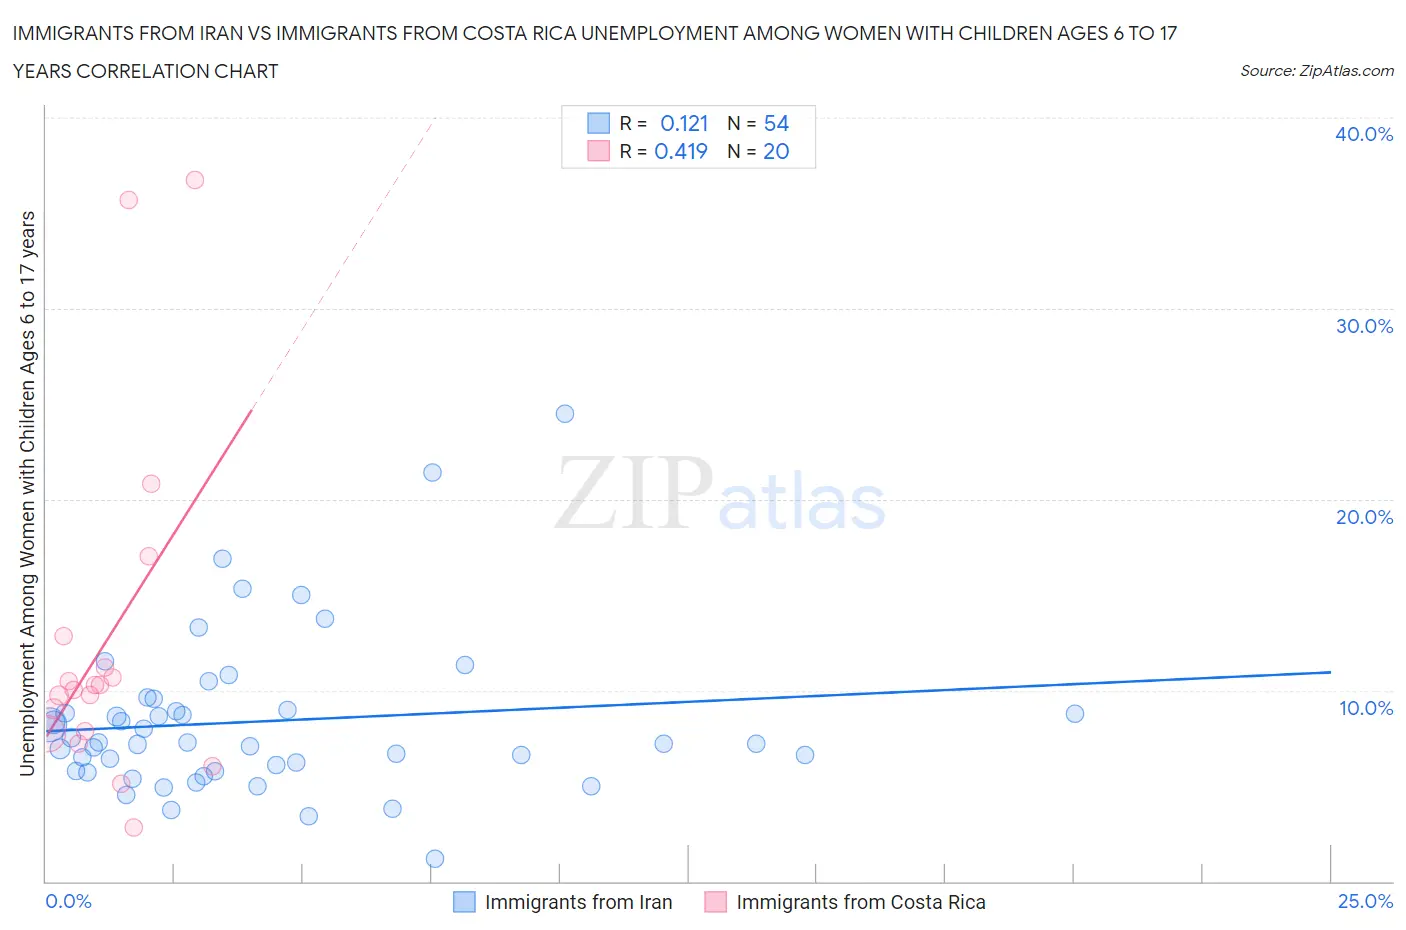
Immigrants from Iran vs Immigrants from Costa Rica Unemployment Among Women with Children Ages 6 to 17 years Correlation Chart
The statistical analysis conducted on geographies consisting of 214,519,414 people shows a poor positive correlation between the proportion of Immigrants from Iran and unemployment rate among women with children between the ages 6 and 17 in the United States with a correlation coefficient (R) of 0.121 and weighted average of 7.9%. Similarly, the statistical analysis conducted on geographies consisting of 165,891,261 people shows a moderate positive correlation between the proportion of Immigrants from Costa Rica and unemployment rate among women with children between the ages 6 and 17 in the United States with a correlation coefficient (R) of 0.419 and weighted average of 9.0%, a difference of 13.5%.
Unemployment Among Women with Children Ages 6 to 17 years Correlation Summary
| Measurement | Immigrants from Iran | Immigrants from Costa Rica |
| Minimum | 1.2% | 2.8% |
| Maximum | 24.5% | 36.7% |
| Range | 23.3% | 33.9% |
| Mean | 8.4% | 12.6% |
| Median | 7.2% | 10.1% |
| Interquartile 25% (IQ1) | 5.8% | 7.8% |
| Interquartile 75% (IQ3) | 9.0% | 12.0% |
| Interquartile Range (IQR) | 3.2% | 4.2% |
| Standard Deviation (Sample) | 4.2% | 9.0% |
| Standard Deviation (Population) | 4.2% | 8.7% |
Similar Demographics by Unemployment Among Women with Children Ages 6 to 17 years
Demographics Similar to Immigrants from Iran by Unemployment Among Women with Children Ages 6 to 17 years
In terms of unemployment among women with children ages 6 to 17 years, the demographic groups most similar to Immigrants from Iran are Laotian (7.9%, a difference of 0.19%), Immigrants from Cambodia (7.9%, a difference of 0.24%), Immigrants from Korea (7.9%, a difference of 0.29%), Native Hawaiian (7.9%, a difference of 0.58%), and Immigrants from South Central Asia (7.9%, a difference of 0.68%).
| Demographics | Rating | Rank | Unemployment Among Women with Children Ages 6 to 17 years |
| Immigrants | Indonesia | 100.0 /100 | #23 | Exceptional 7.7% |
| Nepalese | 100.0 /100 | #24 | Exceptional 7.7% |
| Immigrants | Eastern Asia | 100.0 /100 | #25 | Exceptional 7.7% |
| Indians (Asian) | 100.0 /100 | #26 | Exceptional 7.7% |
| Immigrants | Afghanistan | 100.0 /100 | #27 | Exceptional 7.8% |
| Immigrants | Uzbekistan | 100.0 /100 | #28 | Exceptional 7.8% |
| Thais | 100.0 /100 | #29 | Exceptional 7.8% |
| Immigrants | Iran | 100.0 /100 | #30 | Exceptional 7.9% |
| Laotians | 100.0 /100 | #31 | Exceptional 7.9% |
| Immigrants | Cambodia | 100.0 /100 | #32 | Exceptional 7.9% |
| Immigrants | Korea | 100.0 /100 | #33 | Exceptional 7.9% |
| Native Hawaiians | 100.0 /100 | #34 | Exceptional 7.9% |
| Immigrants | South Central Asia | 100.0 /100 | #35 | Exceptional 7.9% |
| Burmese | 100.0 /100 | #36 | Exceptional 8.0% |
| Asians | 100.0 /100 | #37 | Exceptional 8.0% |
Demographics Similar to Immigrants from Costa Rica by Unemployment Among Women with Children Ages 6 to 17 years
In terms of unemployment among women with children ages 6 to 17 years, the demographic groups most similar to Immigrants from Costa Rica are Immigrants from Brazil (9.0%, a difference of 0.050%), Jordanian (9.0%, a difference of 0.10%), Immigrants from West Indies (9.0%, a difference of 0.10%), Turkish (8.9%, a difference of 0.18%), and Immigrants from Sierra Leone (9.0%, a difference of 0.18%).
| Demographics | Rating | Rank | Unemployment Among Women with Children Ages 6 to 17 years |
| Immigrants | England | 57.7 /100 | #167 | Average 8.9% |
| Immigrants | Croatia | 57.1 /100 | #168 | Average 8.9% |
| British | 55.2 /100 | #169 | Average 8.9% |
| Turks | 54.1 /100 | #170 | Average 8.9% |
| Jordanians | 52.2 /100 | #171 | Average 9.0% |
| Immigrants | West Indies | 52.2 /100 | #172 | Average 9.0% |
| Immigrants | Brazil | 51.0 /100 | #173 | Average 9.0% |
| Immigrants | Costa Rica | 50.0 /100 | #174 | Average 9.0% |
| Immigrants | Sierra Leone | 45.9 /100 | #175 | Average 9.0% |
| Immigrants | Italy | 43.7 /100 | #176 | Average 9.0% |
| Immigrants | Jordan | 41.6 /100 | #177 | Average 9.0% |
| Menominee | 39.3 /100 | #178 | Fair 9.0% |
| Immigrants | Zaire | 38.3 /100 | #179 | Fair 9.0% |
| Ethiopians | 37.6 /100 | #180 | Fair 9.0% |
| Immigrants | Czechoslovakia | 34.5 /100 | #181 | Fair 9.0% |