Immigrants from India vs Paiute Unemployment
COMPARE
Immigrants from India
Paiute
Unemployment
Unemployment Comparison
Immigrants from India
Paiute
4.5%
UNEMPLOYMENT
100.0/ 100
METRIC RATING
7th/ 347
METRIC RANK
7.1%
UNEMPLOYMENT
0.0/ 100
METRIC RATING
326th/ 347
METRIC RANK
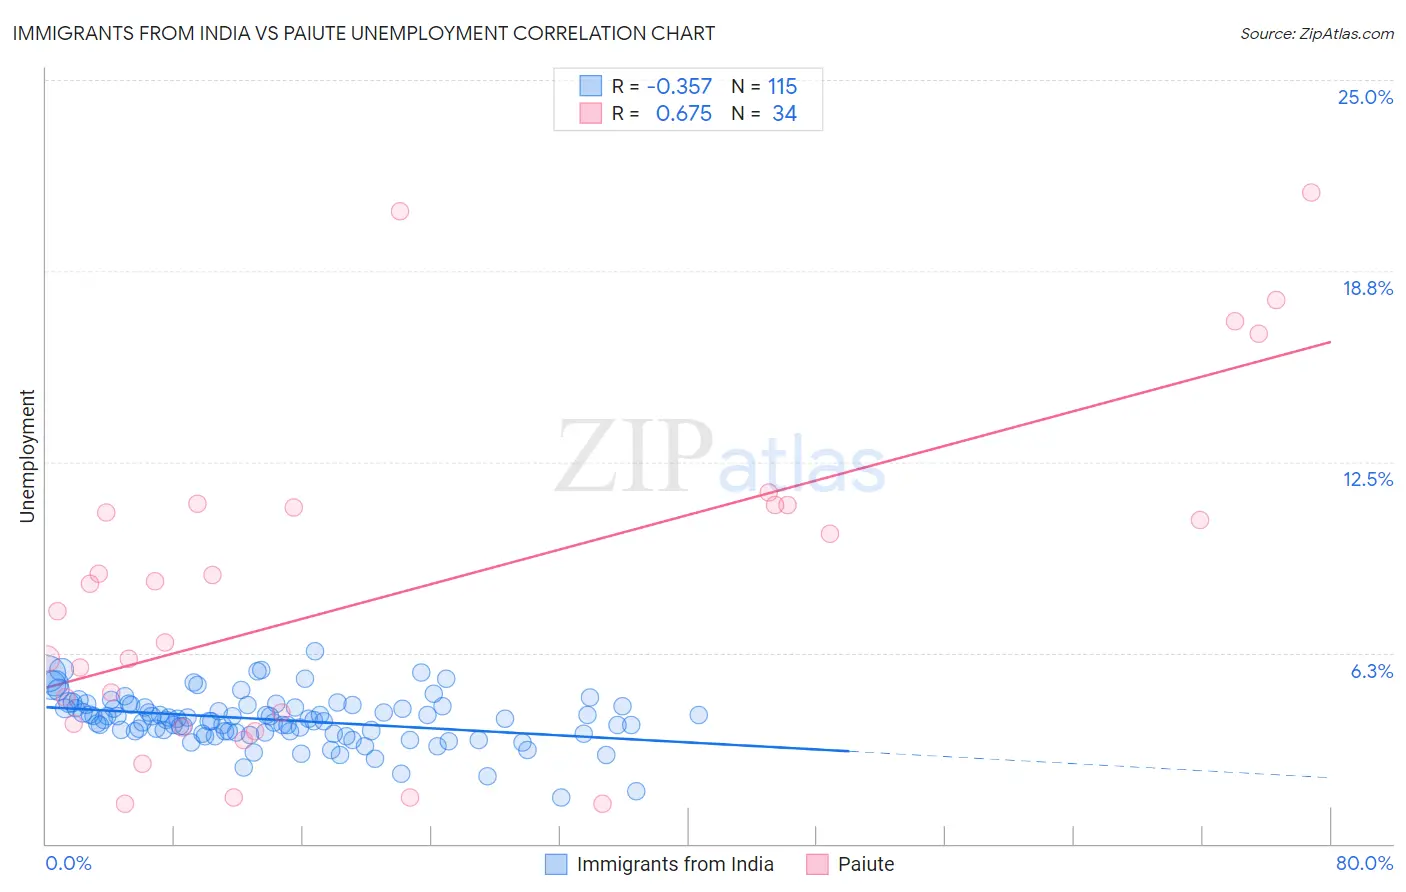
Immigrants from India vs Paiute Unemployment Correlation Chart
The statistical analysis conducted on geographies consisting of 433,651,365 people shows a mild negative correlation between the proportion of Immigrants from India and unemployment in the United States with a correlation coefficient (R) of -0.357 and weighted average of 4.5%. Similarly, the statistical analysis conducted on geographies consisting of 58,375,117 people shows a significant positive correlation between the proportion of Paiute and unemployment in the United States with a correlation coefficient (R) of 0.675 and weighted average of 7.1%, a difference of 57.8%.
Unemployment Correlation Summary
| Measurement | Immigrants from India | Paiute |
| Minimum | 1.5% | 1.3% |
| Maximum | 6.3% | 21.3% |
| Range | 4.8% | 20.0% |
| Mean | 4.1% | 8.4% |
| Median | 4.1% | 8.1% |
| Interquartile 25% (IQ1) | 3.6% | 3.9% |
| Interquartile 75% (IQ3) | 4.5% | 11.1% |
| Interquartile Range (IQR) | 0.85% | 7.2% |
| Standard Deviation (Sample) | 0.80% | 5.5% |
| Standard Deviation (Population) | 0.80% | 5.4% |
Similar Demographics by Unemployment
Demographics Similar to Immigrants from India by Unemployment
In terms of unemployment, the demographic groups most similar to Immigrants from India are Swiss (4.5%, a difference of 0.46%), German (4.5%, a difference of 0.55%), Scandinavian (4.5%, a difference of 0.86%), Swedish (4.4%, a difference of 1.3%), and Dutch (4.6%, a difference of 1.4%).
| Demographics | Rating | Rank | Unemployment |
| Norwegians | 100.0 /100 | #1 | Exceptional 4.2% |
| Luxembourgers | 100.0 /100 | #2 | Exceptional 4.3% |
| Czechs | 100.0 /100 | #3 | Exceptional 4.3% |
| Danes | 100.0 /100 | #4 | Exceptional 4.3% |
| Swedes | 100.0 /100 | #5 | Exceptional 4.4% |
| Germans | 100.0 /100 | #6 | Exceptional 4.5% |
| Immigrants | India | 100.0 /100 | #7 | Exceptional 4.5% |
| Swiss | 100.0 /100 | #8 | Exceptional 4.5% |
| Scandinavians | 100.0 /100 | #9 | Exceptional 4.5% |
| Dutch | 100.0 /100 | #10 | Exceptional 4.6% |
| English | 100.0 /100 | #11 | Exceptional 4.6% |
| Pennsylvania Germans | 100.0 /100 | #12 | Exceptional 4.6% |
| Belgians | 100.0 /100 | #13 | Exceptional 4.6% |
| Immigrants | Cuba | 100.0 /100 | #14 | Exceptional 4.6% |
| Europeans | 99.9 /100 | #15 | Exceptional 4.6% |
Demographics Similar to Paiute by Unemployment
In terms of unemployment, the demographic groups most similar to Paiute are Pueblo (7.2%, a difference of 0.53%), Native/Alaskan (7.0%, a difference of 1.1%), Tsimshian (7.2%, a difference of 1.4%), Immigrants from Armenia (7.0%, a difference of 1.7%), and Alaska Native (7.2%, a difference of 1.8%).
| Demographics | Rating | Rank | Unemployment |
| British West Indians | 0.0 /100 | #319 | Tragic 6.8% |
| Immigrants | St. Vincent and the Grenadines | 0.0 /100 | #320 | Tragic 6.9% |
| Immigrants | Guyana | 0.0 /100 | #321 | Tragic 6.9% |
| Guyanese | 0.0 /100 | #322 | Tragic 6.9% |
| Immigrants | Grenada | 0.0 /100 | #323 | Tragic 6.9% |
| Immigrants | Armenia | 0.0 /100 | #324 | Tragic 7.0% |
| Natives/Alaskans | 0.0 /100 | #325 | Tragic 7.0% |
| Paiute | 0.0 /100 | #326 | Tragic 7.1% |
| Pueblo | 0.0 /100 | #327 | Tragic 7.2% |
| Tsimshian | 0.0 /100 | #328 | Tragic 7.2% |
| Alaska Natives | 0.0 /100 | #329 | Tragic 7.2% |
| Yakama | 0.0 /100 | #330 | Tragic 7.3% |
| Dominicans | 0.0 /100 | #331 | Tragic 7.4% |
| Sioux | 0.0 /100 | #332 | Tragic 7.4% |
| Immigrants | Dominican Republic | 0.0 /100 | #333 | Tragic 7.4% |