Immigrants from India vs Immigrants from Israel Unemployment Among Ages 60 to 64 years

COMPARE

Immigrants from India
Race
Ancestry
AfghanAfricanAlaska NativeAlaskan AthabascanAlbanianAleutAlsatianAmericanApacheArabArapahoArgentineanArmenianAssyrian/Chaldean/SyriacAustralianAustrianBahamianBangladeshiBarbadianBasqueBelgianBelizeanBermudanBhutaneseBlackfeetBolivianBrazilianBritishBritish West IndianBulgarianBurmeseCajunCambodianCanadianCape VerdeanCarpatho RusynCelticCentral AmericanCentral American IndianCherokeeCheyenneChickasawChileanChineseChippewaChoctawColombianColvilleComancheCosta RicanCreeCreekCroatianCrowCubanCypriotCzechCzechoslovakianDanishDelawareDominicanDutchDutch West IndianEastern EuropeanEcuadorianEgyptianEnglishEstonianEthiopianEuropeanFijianFilipinoFinnishFrenchFrench American IndianFrench CanadianGermanGerman RussianGhanaianGreekGuamanian/ChamorroGuatemalanGuyaneseHaitianHmongHonduranHopiHoumaHungarianIcelanderIndian (Asian)IndonesianInupiatIranianIraqiIrishIroquoisIsraeliItalianJamaicanJapaneseJordanianKenyanKiowaKoreanLaotianLatvianLebaneseLiberianLithuanianLumbeeLuxembourgerMacedonianMalaysianMalteseMarshalleseMenomineeMexicanMexican American IndianMongolianMoroccanNative HawaiianNavajoNepaleseNew ZealanderNicaraguanNigerianNorthern EuropeanNorwegianOkinawanOsageOttawaPaiutePakistaniPalestinianPanamanianParaguayanPennsylvania GermanPeruvianPimaPolishPortuguesePotawatomiPuebloPuerto RicanPuget Sound SalishRomanianRussianSalvadoranSamoanScandinavianScotch-IrishScottishSeminoleSenegaleseSerbianShoshoneSierra LeoneanSiouxSlavicSlovakSloveneSomaliSouth AfricanSouth AmericanSouth American IndianSoviet UnionSpaniardSpanishSpanish AmericanSpanish American IndianSri LankanSubsaharan AfricanSudaneseSwedishSwissSyrianTaiwaneseThaiTlingit-HaidaTohono O'OdhamTonganTrinidadian and TobagonianTsimshianTurkishU.S. Virgin IslanderUgandanUkrainianUruguayanUteVenezuelanVietnameseWelshWest IndianYakamaYaquiYugoslavianYumanYup'ikZimbabwean
Immigration
NonimmigrantsImmigrantsAfghanistanAfricaAlbaniaArgentinaArmeniaAsiaAustraliaAustriaBahamasBangladeshBarbadosBelarusBelgiumBelizeBoliviaBosnia and HerzegovinaBrazilBulgariaBurma/MyanmarCabo VerdeCambodiaCameroonCanadaCaribbeanCentral AmericaChileChinaColombiaCongoCosta RicaCroatiaCubaCzechoslovakiaDenmarkDominicaDominican RepublicEastern AfricaEastern AsiaEastern EuropeEcuadorEgyptEl SalvadorEnglandEritreaEthiopiaEuropeFijiFranceGermanyGhanaGreeceGrenadaGuatemalaGuyanaHaitiHondurasHong KongHungaryIndiaIndonesiaIranIraqIrelandItalyJamaicaJapanJordanKazakhstanKenyaKoreaKuwaitLaosLatin AmericaLatviaLebanonLiberiaLithuaniaMalaysiaMexicoMicronesiaMiddle AfricaMoldovaMoroccoNepalNetherlandsNicaraguaNigeriaNorth AmericaNorth MacedoniaNorthern AfricaNorthern EuropeNorwayOceaniaPakistanPanamaPeruPhilippinesPolandPortugalRomaniaRussiaSaudi ArabiaScotlandSenegalSerbiaSierra LeoneSingaporeSomaliaSouth AfricaSouth AmericaSouth Central AsiaSouth Eastern AsiaSouthern EuropeSpainSri LankaSt. Vincent and the GrenadinesSudanSwedenSwitzerlandSyriaTaiwanThailandTrinidad and TobagoTurkeyUgandaUkraineUruguayUzbekistanVenezuelaVietnamWest IndiesWestern AfricaWestern AsiaWestern EuropeYemenZaireZimbabweAzores
Immigrants from Israel
Race
Ancestry
AfghanAfricanAlaska NativeAlaskan AthabascanAlbanianAleutAlsatianAmericanApacheArabArapahoArgentineanArmenianAssyrian/Chaldean/SyriacAustralianAustrianBahamianBangladeshiBarbadianBasqueBelgianBelizeanBermudanBhutaneseBlackfeetBolivianBrazilianBritishBritish West IndianBulgarianBurmeseCajunCambodianCanadianCape VerdeanCarpatho RusynCelticCentral AmericanCentral American IndianCherokeeCheyenneChickasawChileanChineseChippewaChoctawColombianColvilleComancheCosta RicanCreeCreekCroatianCrowCubanCypriotCzechCzechoslovakianDanishDelawareDominicanDutchDutch West IndianEastern EuropeanEcuadorianEgyptianEnglishEstonianEthiopianEuropeanFijianFilipinoFinnishFrenchFrench American IndianFrench CanadianGermanGerman RussianGhanaianGreekGuamanian/ChamorroGuatemalanGuyaneseHaitianHmongHonduranHopiHoumaHungarianIcelanderIndian (Asian)IndonesianInupiatIranianIraqiIrishIroquoisIsraeliItalianJamaicanJapaneseJordanianKenyanKiowaKoreanLaotianLatvianLebaneseLiberianLithuanianLumbeeLuxembourgerMacedonianMalaysianMalteseMarshalleseMenomineeMexicanMexican American IndianMongolianMoroccanNative HawaiianNavajoNepaleseNew ZealanderNicaraguanNigerianNorthern EuropeanNorwegianOkinawanOsageOttawaPaiutePakistaniPalestinianPanamanianParaguayanPennsylvania GermanPeruvianPimaPolishPortuguesePotawatomiPuebloPuerto RicanPuget Sound SalishRomanianRussianSalvadoranSamoanScandinavianScotch-IrishScottishSeminoleSenegaleseSerbianShoshoneSierra LeoneanSiouxSlavicSlovakSloveneSomaliSouth AfricanSouth AmericanSouth American IndianSoviet UnionSpaniardSpanishSpanish AmericanSpanish American IndianSri LankanSubsaharan AfricanSudaneseSwedishSwissSyrianTaiwaneseThaiTlingit-HaidaTohono O'OdhamTonganTrinidadian and TobagonianTsimshianTurkishU.S. Virgin IslanderUgandanUkrainianUruguayanUteVenezuelanVietnameseWelshWest IndianYakamaYaquiYugoslavianYumanYup'ikZimbabwean
Immigration
NonimmigrantsImmigrantsAfghanistanAfricaAlbaniaArgentinaArmeniaAsiaAustraliaAustriaBahamasBangladeshBarbadosBelarusBelgiumBelizeBoliviaBosnia and HerzegovinaBrazilBulgariaBurma/MyanmarCabo VerdeCambodiaCameroonCanadaCaribbeanCentral AmericaChileChinaColombiaCongoCosta RicaCroatiaCubaCzechoslovakiaDenmarkDominicaDominican RepublicEastern AfricaEastern AsiaEastern EuropeEcuadorEgyptEl SalvadorEnglandEritreaEthiopiaEuropeFijiFranceGermanyGhanaGreeceGrenadaGuatemalaGuyanaHaitiHondurasHong KongHungaryIndonesiaIranIraqIrelandIsraelItalyJamaicaJapanJordanKazakhstanKenyaKoreaKuwaitLaosLatin AmericaLatviaLebanonLiberiaLithuaniaMalaysiaMexicoMicronesiaMiddle AfricaMoldovaMoroccoNepalNetherlandsNicaraguaNigeriaNorth AmericaNorth MacedoniaNorthern AfricaNorthern EuropeNorwayOceaniaPakistanPanamaPeruPhilippinesPolandPortugalRomaniaRussiaSaudi ArabiaScotlandSenegalSerbiaSierra LeoneSingaporeSomaliaSouth AfricaSouth AmericaSouth Central AsiaSouth Eastern AsiaSouthern EuropeSpainSri LankaSt. Vincent and the GrenadinesSudanSwedenSwitzerlandSyriaTaiwanThailandTrinidad and TobagoTurkeyUgandaUkraineUruguayUzbekistanVenezuelaVietnamWest IndiesWestern AfricaWestern AsiaWestern EuropeYemenZaireZimbabweAzores
Unemployment Among Ages 60 to 64 years
Income
Poverty
Unemployment
Labor Participation
Family Structure
Vehicle Availability
Education Level
Disability

Unemployment Among Ages 60 to 64 years Comparison

Immigrants from India

Immigrants from Israel

Exceptional
Tragic
4.6%
UNEMPLOYMENT AMONG AGES 60 TO 64 YEARS
99.8/ 100
METRIC RATING
58th/ 347
METRIC RANK
5.3%
UNEMPLOYMENT AMONG AGES 60 TO 64 YEARS
0.0/ 100
METRIC RATING
293rd/ 347
METRIC RANK

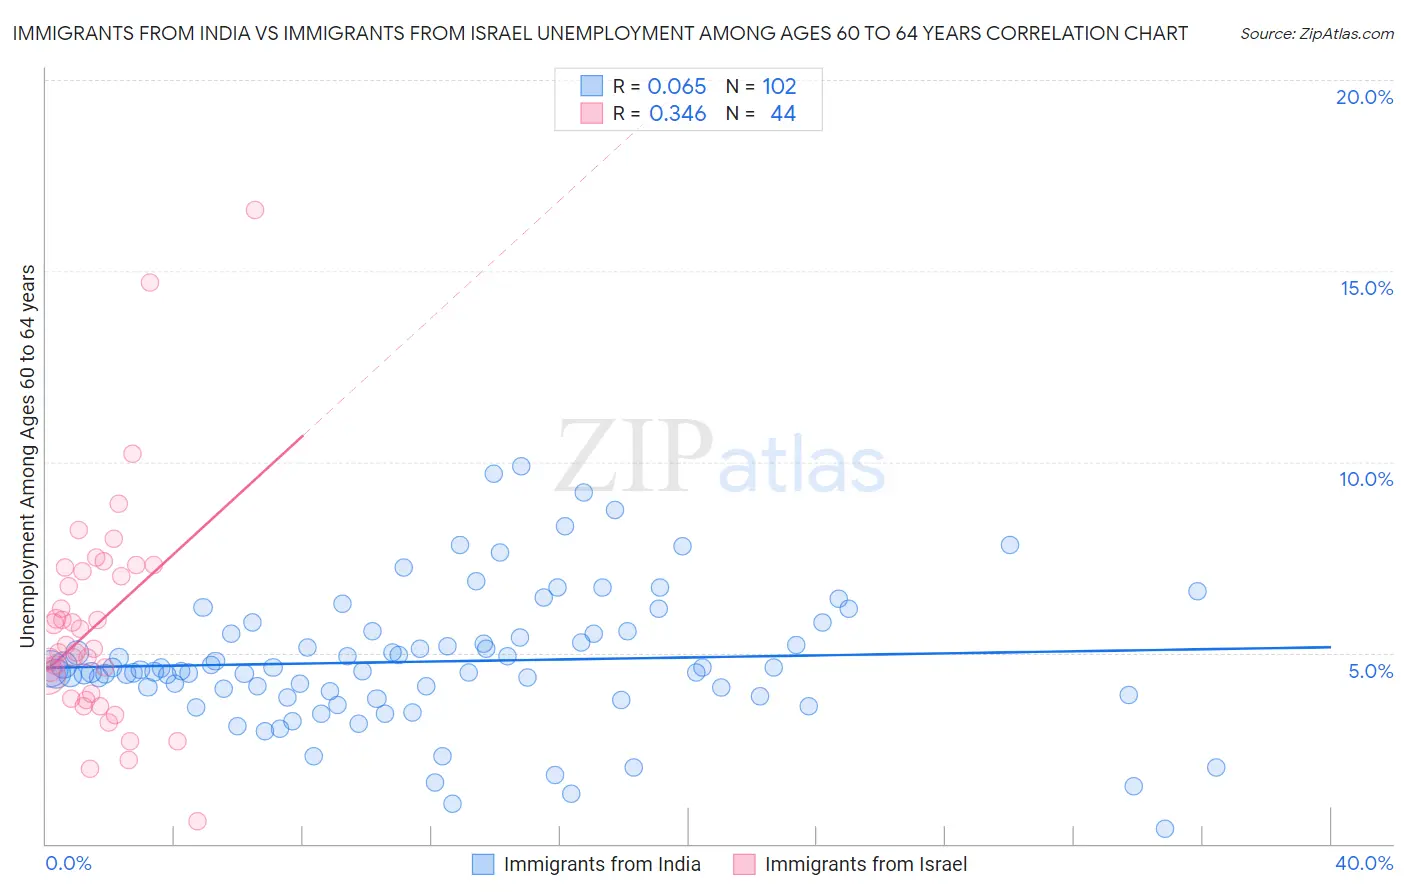
Immigrants from India vs Immigrants from Israel Unemployment Among Ages 60 to 64 years Correlation Chart

The statistical analysis conducted on geographies consisting of 388,865,585 people shows a slight positive correlation between the proportion of Immigrants from India and unemployment rate among population between the ages 60 and 64 in the United States with a correlation coefficient (R) of 0.065 and weighted average of 4.6%. Similarly, the statistical analysis conducted on geographies consisting of 200,674,743 people shows a mild positive correlation between the proportion of Immigrants from Israel and unemployment rate among population between the ages 60 and 64 in the United States with a correlation coefficient (R) of 0.346 and weighted average of 5.3%, a difference of 16.0%.
Immigrants from India vs Immigrants from Israel Unemployment Among Ages 60 to 64 years

Unemployment Among Ages 60 to 64 years Correlation Summary

MeasurementImmigrants from IndiaImmigrants from Israel
Minimum0.40%0.60%
Maximum9.9%16.6%
Range9.5%16.0%
Mean4.8%5.8%
Median4.5%5.2%
Interquartile 25% (IQ1)3.9%3.9%
Interquartile 75% (IQ3)5.5%7.2%
Interquartile Range (IQR)1.6%3.3%
Standard Deviation (Sample)1.8%2.9%
Standard Deviation (Population)1.8%2.9%

Similar Demographics by Unemployment Among Ages 60 to 64 years

Demographics Similar to Immigrants from India by Unemployment Among Ages 60 to 64 years

In terms of unemployment among ages 60 to 64 years, the demographic groups most similar to Immigrants from India are British (4.6%, a difference of 0.050%), Welsh (4.6%, a difference of 0.070%), Swiss (4.6%, a difference of 0.10%), Puget Sound Salish (4.6%, a difference of 0.12%), and Bangladeshi (4.6%, a difference of 0.16%).
DemographicsRating | RankUnemployment Among Ages 60 to 64 years
Immigrants | Kenya
99.9
/100
|
#51
Exceptional
4.6%
Kenyans
99.9
/100
|
#52
Exceptional
4.6%
Immigrants | Moldova
99.9
/100
|
#53
Exceptional
4.6%
Dutch
99.9
/100
|
#54
Exceptional
4.6%
Bangladeshis
99.9
/100
|
#55
Exceptional
4.6%
Welsh
99.9
/100
|
#56
Exceptional
4.6%
British
99.9
/100
|
#57
Exceptional
4.6%
Immigrants | India
99.8
/100
|
#58
Exceptional
4.6%
Swiss
99.8
/100
|
#59
Exceptional
4.6%
Puget Sound Salish
99.8
/100
|
#60
Exceptional
4.6%
Lebanese
99.8
/100
|
#61
Exceptional
4.6%
Senegalese
99.7
/100
|
#62
Exceptional
4.6%
Czechoslovakians
99.7
/100
|
#63
Exceptional
4.6%
Immigrants | Middle Africa
99.7
/100
|
#64
Exceptional
4.6%
Jordanians
99.7
/100
|
#65
Exceptional
4.6%

Demographics Similar to Immigrants from Israel by Unemployment Among Ages 60 to 64 years

In terms of unemployment among ages 60 to 64 years, the demographic groups most similar to Immigrants from Israel are Immigrants from Latin America (5.3%, a difference of 0.020%), Hispanic or Latino (5.3%, a difference of 0.040%), Black/African American (5.3%, a difference of 0.11%), Armenian (5.3%, a difference of 0.14%), and Jamaican (5.3%, a difference of 0.26%).
DemographicsRating | RankUnemployment Among Ages 60 to 64 years
Mexican American Indians
0.0
/100
|
#286
Tragic
5.3%
Salvadorans
0.0
/100
|
#287
Tragic
5.3%
Trinidadians and Tobagonians
0.0
/100
|
#288
Tragic
5.3%
Spanish Americans
0.0
/100
|
#289
Tragic
5.3%
Immigrants | Trinidad and Tobago
0.0
/100
|
#290
Tragic
5.3%
Hispanics or Latinos
0.0
/100
|
#291
Tragic
5.3%
Immigrants | Latin America
0.0
/100
|
#292
Tragic
5.3%
Immigrants | Israel
0.0
/100
|
#293
Tragic
5.3%
Blacks/African Americans
0.0
/100
|
#294
Tragic
5.3%
Armenians
0.0
/100
|
#295
Tragic
5.3%
Jamaicans
0.0
/100
|
#296
Tragic
5.3%
Osage
0.0
/100
|
#297
Tragic
5.4%
Immigrants | Central America
0.0
/100
|
#298
Tragic
5.4%
Immigrants | El Salvador
0.0
/100
|
#299
Tragic
5.4%
Immigrants | Barbados
0.0
/100
|
#300
Tragic
5.4%