Immigrants from India vs Immigrants from Central America Unemployment Among Women with Children Under 6 years
COMPARE
Immigrants from India
Immigrants from Central America
Unemployment Among Women with Children Under 6 years
Unemployment Among Women with Children Under 6 years Comparison
Immigrants from India
Immigrants from Central America
6.1%
UNEMPLOYMENT AMONG WOMEN WITH CHILDREN UNDER 6 YEARS
100.0/ 100
METRIC RATING
8th/ 347
METRIC RANK
8.9%
UNEMPLOYMENT AMONG WOMEN WITH CHILDREN UNDER 6 YEARS
0.0/ 100
METRIC RATING
295th/ 347
METRIC RANK
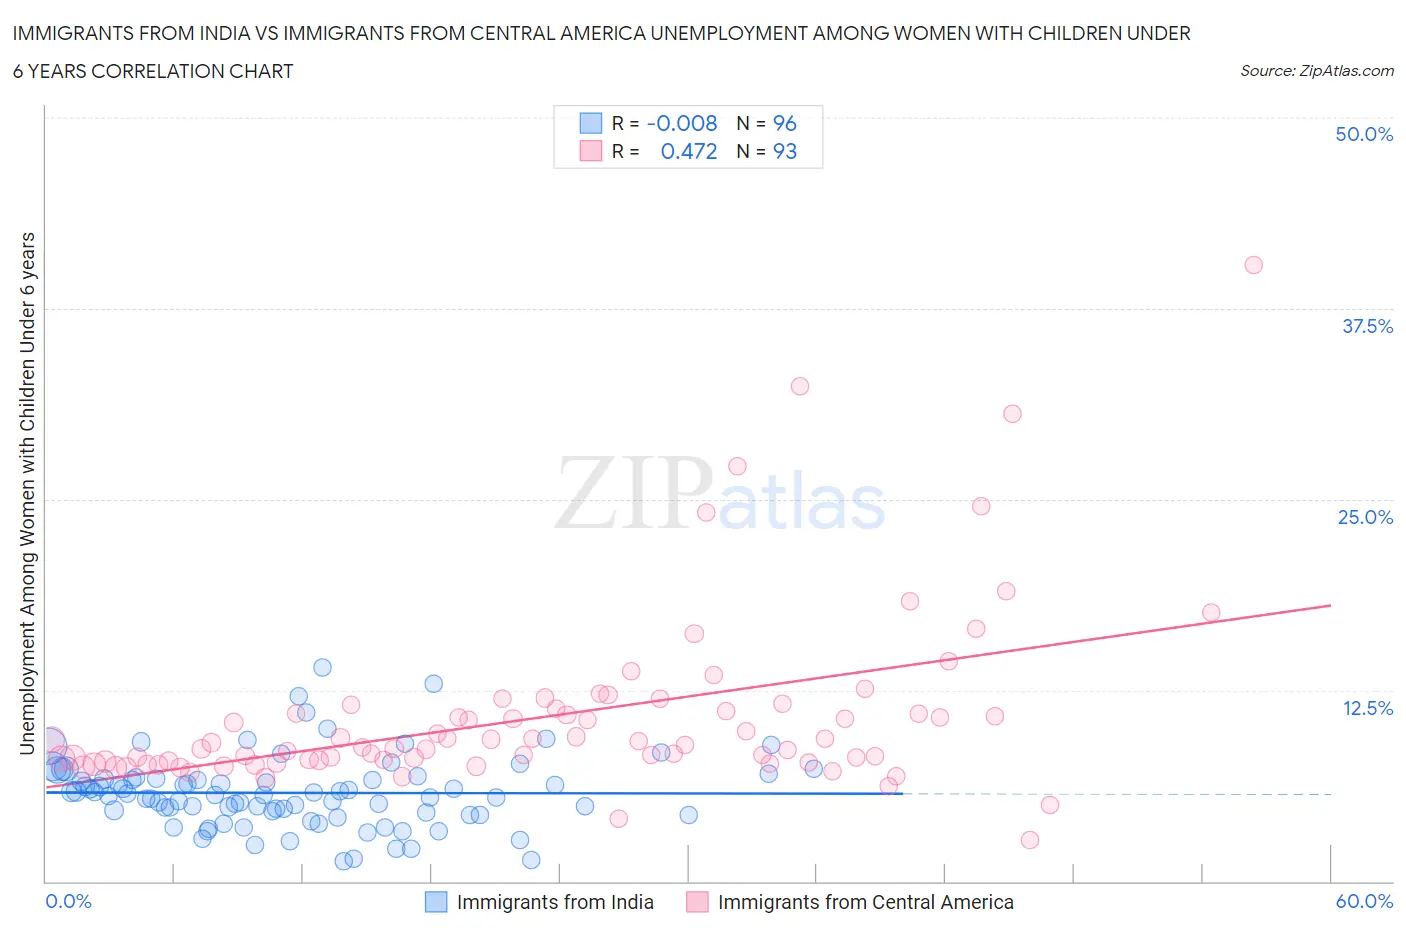
Immigrants from India vs Immigrants from Central America Unemployment Among Women with Children Under 6 years Correlation Chart
The statistical analysis conducted on geographies consisting of 323,503,780 people shows no correlation between the proportion of Immigrants from India and unemployment rate among women with children under the age of 6 in the United States with a correlation coefficient (R) of -0.008 and weighted average of 6.1%. Similarly, the statistical analysis conducted on geographies consisting of 368,932,426 people shows a moderate positive correlation between the proportion of Immigrants from Central America and unemployment rate among women with children under the age of 6 in the United States with a correlation coefficient (R) of 0.472 and weighted average of 8.9%, a difference of 45.0%.
Unemployment Among Women with Children Under 6 years Correlation Summary
| Measurement | Immigrants from India | Immigrants from Central America |
| Minimum | 1.3% | 2.7% |
| Maximum | 14.0% | 40.4% |
| Range | 12.7% | 37.7% |
| Mean | 5.8% | 10.8% |
| Median | 5.7% | 8.9% |
| Interquartile 25% (IQ1) | 4.4% | 7.8% |
| Interquartile 75% (IQ3) | 6.7% | 11.2% |
| Interquartile Range (IQR) | 2.3% | 3.4% |
| Standard Deviation (Sample) | 2.3% | 5.9% |
| Standard Deviation (Population) | 2.3% | 5.9% |
Similar Demographics by Unemployment Among Women with Children Under 6 years
Demographics Similar to Immigrants from India by Unemployment Among Women with Children Under 6 years
In terms of unemployment among women with children under 6 years, the demographic groups most similar to Immigrants from India are Filipino (6.1%, a difference of 0.45%), Taiwanese (6.1%, a difference of 0.49%), Immigrants from Taiwan (6.0%, a difference of 1.0%), Immigrants from China (6.2%, a difference of 1.9%), and Cape Verdean (5.9%, a difference of 2.7%).
| Demographics | Rating | Rank | Unemployment Among Women with Children Under 6 years |
| Immigrants | Cabo Verde | 100.0 /100 | #1 | Exceptional 5.4% |
| Immigrants | Hong Kong | 100.0 /100 | #2 | Exceptional 5.8% |
| Okinawans | 100.0 /100 | #3 | Exceptional 5.8% |
| Cambodians | 100.0 /100 | #4 | Exceptional 5.9% |
| Cape Verdeans | 100.0 /100 | #5 | Exceptional 5.9% |
| Immigrants | Taiwan | 100.0 /100 | #6 | Exceptional 6.0% |
| Taiwanese | 100.0 /100 | #7 | Exceptional 6.1% |
| Immigrants | India | 100.0 /100 | #8 | Exceptional 6.1% |
| Filipinos | 100.0 /100 | #9 | Exceptional 6.1% |
| Immigrants | China | 100.0 /100 | #10 | Exceptional 6.2% |
| Indians (Asian) | 100.0 /100 | #11 | Exceptional 6.3% |
| Immigrants | Singapore | 100.0 /100 | #12 | Exceptional 6.3% |
| Immigrants | Eastern Asia | 100.0 /100 | #13 | Exceptional 6.3% |
| Immigrants | Bulgaria | 100.0 /100 | #14 | Exceptional 6.3% |
| Thais | 100.0 /100 | #15 | Exceptional 6.3% |
Demographics Similar to Immigrants from Central America by Unemployment Among Women with Children Under 6 years
In terms of unemployment among women with children under 6 years, the demographic groups most similar to Immigrants from Central America are Nonimmigrants (8.8%, a difference of 0.050%), Immigrants from Dominican Republic (8.9%, a difference of 0.13%), Immigrants from Bangladesh (8.8%, a difference of 0.23%), Mexican (8.9%, a difference of 0.23%), and Tlingit-Haida (8.9%, a difference of 0.39%).
| Demographics | Rating | Rank | Unemployment Among Women with Children Under 6 years |
| Bahamians | 0.0 /100 | #288 | Tragic 8.7% |
| Iroquois | 0.0 /100 | #289 | Tragic 8.7% |
| Vietnamese | 0.0 /100 | #290 | Tragic 8.8% |
| Jamaicans | 0.0 /100 | #291 | Tragic 8.8% |
| Cheyenne | 0.0 /100 | #292 | Tragic 8.8% |
| Immigrants | Bangladesh | 0.0 /100 | #293 | Tragic 8.8% |
| Immigrants | Nonimmigrants | 0.0 /100 | #294 | Tragic 8.8% |
| Immigrants | Central America | 0.0 /100 | #295 | Tragic 8.9% |
| Immigrants | Dominican Republic | 0.0 /100 | #296 | Tragic 8.9% |
| Mexicans | 0.0 /100 | #297 | Tragic 8.9% |
| Tlingit-Haida | 0.0 /100 | #298 | Tragic 8.9% |
| Immigrants | Jamaica | 0.0 /100 | #299 | Tragic 8.9% |
| Creek | 0.0 /100 | #300 | Tragic 8.9% |
| Chickasaw | 0.0 /100 | #301 | Tragic 9.0% |
| Hispanics or Latinos | 0.0 /100 | #302 | Tragic 9.0% |