Immigrants from Hungary vs Immigrants from Japan Unemployment Among Seniors over 65 years
COMPARE
Immigrants from Hungary
Immigrants from Japan
Unemployment Among Seniors over 65 years
Unemployment Among Seniors over 65 years Comparison
Immigrants from Hungary
Immigrants from Japan
5.0%
UNEMPLOYMENT AMONG SENIORS OVER 65 YEARS
98.2/ 100
METRIC RATING
85th/ 347
METRIC RANK
4.9%
UNEMPLOYMENT AMONG SENIORS OVER 65 YEARS
99.2/ 100
METRIC RATING
73rd/ 347
METRIC RANK
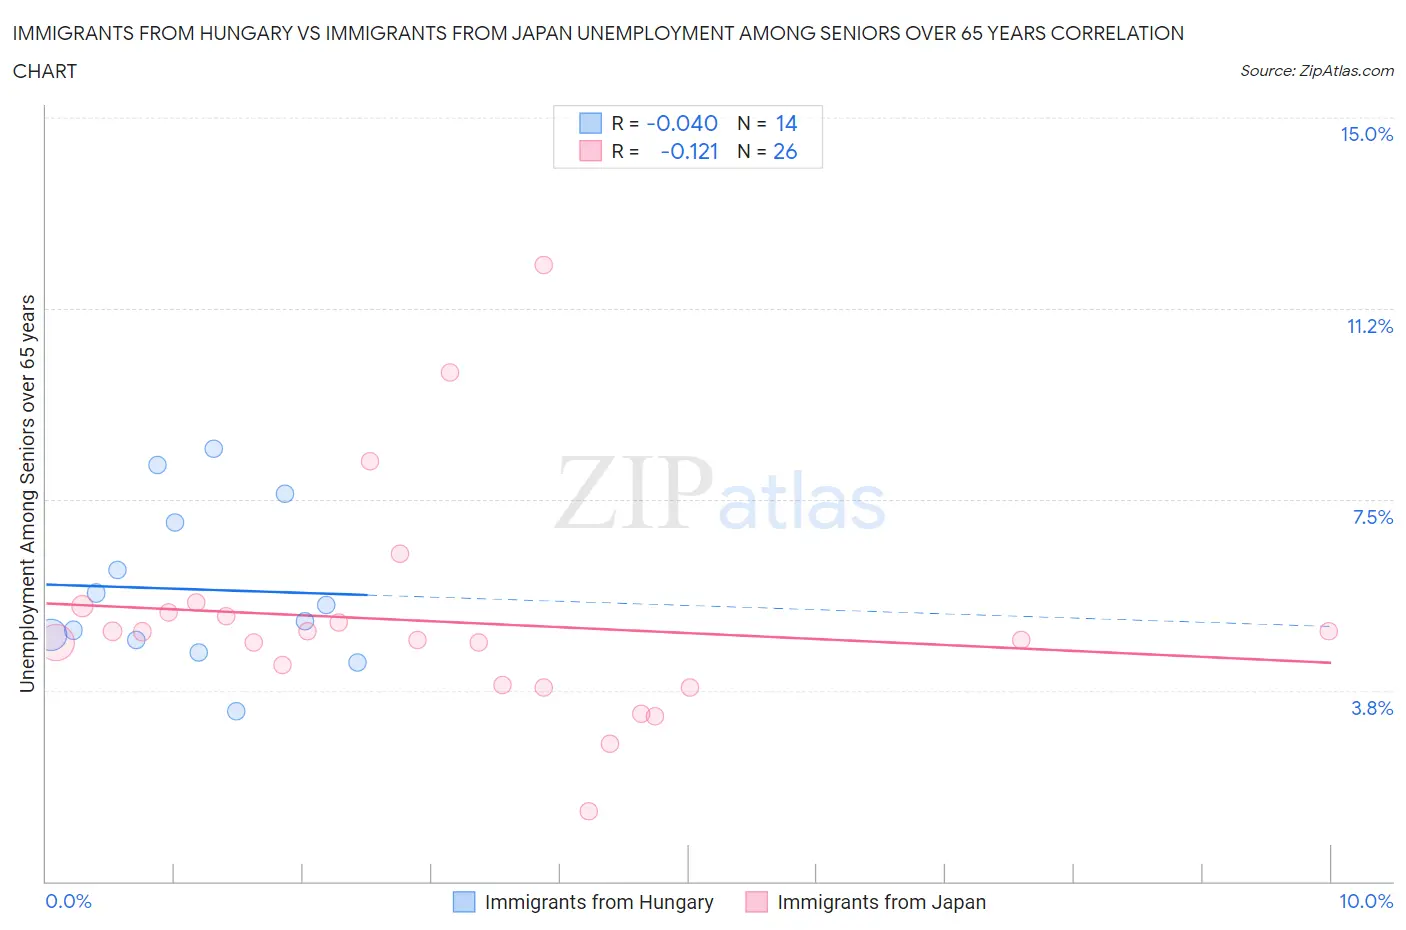
Immigrants from Hungary vs Immigrants from Japan Unemployment Among Seniors over 65 years Correlation Chart
The statistical analysis conducted on geographies consisting of 187,100,092 people shows no correlation between the proportion of Immigrants from Hungary and unemployment rate amomg seniors over the age of 65 in the United States with a correlation coefficient (R) of -0.040 and weighted average of 5.0%. Similarly, the statistical analysis conducted on geographies consisting of 312,855,333 people shows a poor negative correlation between the proportion of Immigrants from Japan and unemployment rate amomg seniors over the age of 65 in the United States with a correlation coefficient (R) of -0.121 and weighted average of 4.9%, a difference of 0.73%.
Unemployment Among Seniors over 65 years Correlation Summary
| Measurement | Immigrants from Hungary | Immigrants from Japan |
| Minimum | 3.3% | 1.4% |
| Maximum | 8.5% | 12.1% |
| Range | 5.2% | 10.7% |
| Mean | 5.7% | 5.1% |
| Median | 5.3% | 4.8% |
| Interquartile 25% (IQ1) | 4.7% | 3.9% |
| Interquartile 75% (IQ3) | 7.1% | 5.3% |
| Interquartile Range (IQR) | 2.3% | 1.4% |
| Standard Deviation (Sample) | 1.5% | 2.2% |
| Standard Deviation (Population) | 1.5% | 2.1% |
Demographics Similar to Immigrants from Hungary and Immigrants from Japan by Unemployment Among Seniors over 65 years
In terms of unemployment among seniors over 65 years, the demographic groups most similar to Immigrants from Hungary are Immigrants from Taiwan (5.0%, a difference of 0.0%), Immigrants from Switzerland (5.0%, a difference of 0.010%), Filipino (5.0%, a difference of 0.060%), Immigrants from Zimbabwe (5.0%, a difference of 0.070%), and Serbian (5.0%, a difference of 0.10%). Similarly, the demographic groups most similar to Immigrants from Japan are Japanese (4.9%, a difference of 0.030%), Nicaraguan (4.9%, a difference of 0.080%), British (4.9%, a difference of 0.11%), Welsh (5.0%, a difference of 0.15%), and Thai (5.0%, a difference of 0.16%).
| Demographics | Rating | Rank | Unemployment Among Seniors over 65 years |
| Scottish | 99.5 /100 | #69 | Exceptional 4.9% |
| Immigrants | Kazakhstan | 99.4 /100 | #70 | Exceptional 4.9% |
| Immigrants | Moldova | 99.4 /100 | #71 | Exceptional 4.9% |
| Nicaraguans | 99.3 /100 | #72 | Exceptional 4.9% |
| Immigrants | Japan | 99.2 /100 | #73 | Exceptional 4.9% |
| Japanese | 99.2 /100 | #74 | Exceptional 4.9% |
| British | 99.1 /100 | #75 | Exceptional 4.9% |
| Welsh | 99.1 /100 | #76 | Exceptional 5.0% |
| Thais | 99.1 /100 | #77 | Exceptional 5.0% |
| Slavs | 98.9 /100 | #78 | Exceptional 5.0% |
| Immigrants | Netherlands | 98.8 /100 | #79 | Exceptional 5.0% |
| Immigrants | Ethiopia | 98.6 /100 | #80 | Exceptional 5.0% |
| Estonians | 98.5 /100 | #81 | Exceptional 5.0% |
| Serbians | 98.4 /100 | #82 | Exceptional 5.0% |
| Immigrants | Zimbabwe | 98.3 /100 | #83 | Exceptional 5.0% |
| Filipinos | 98.3 /100 | #84 | Exceptional 5.0% |
| Immigrants | Hungary | 98.2 /100 | #85 | Exceptional 5.0% |
| Immigrants | Taiwan | 98.2 /100 | #86 | Exceptional 5.0% |
| Immigrants | Switzerland | 98.2 /100 | #87 | Exceptional 5.0% |
| Afghans | 97.6 /100 | #88 | Exceptional 5.0% |
| Immigrants | South Central Asia | 97.6 /100 | #89 | Exceptional 5.0% |