Immigrants from Hungary vs Dominican Unemployment Among Ages 45 to 54 years
COMPARE
Immigrants from Hungary
Dominican
Unemployment Among Ages 45 to 54 years
Unemployment Among Ages 45 to 54 years Comparison
Immigrants from Hungary
Dominicans
4.5%
UNEMPLOYMENT AMONG AGES 45 TO 54 YEARS
50.0/ 100
METRIC RATING
174th/ 347
METRIC RANK
6.2%
UNEMPLOYMENT AMONG AGES 45 TO 54 YEARS
0.0/ 100
METRIC RATING
327th/ 347
METRIC RANK
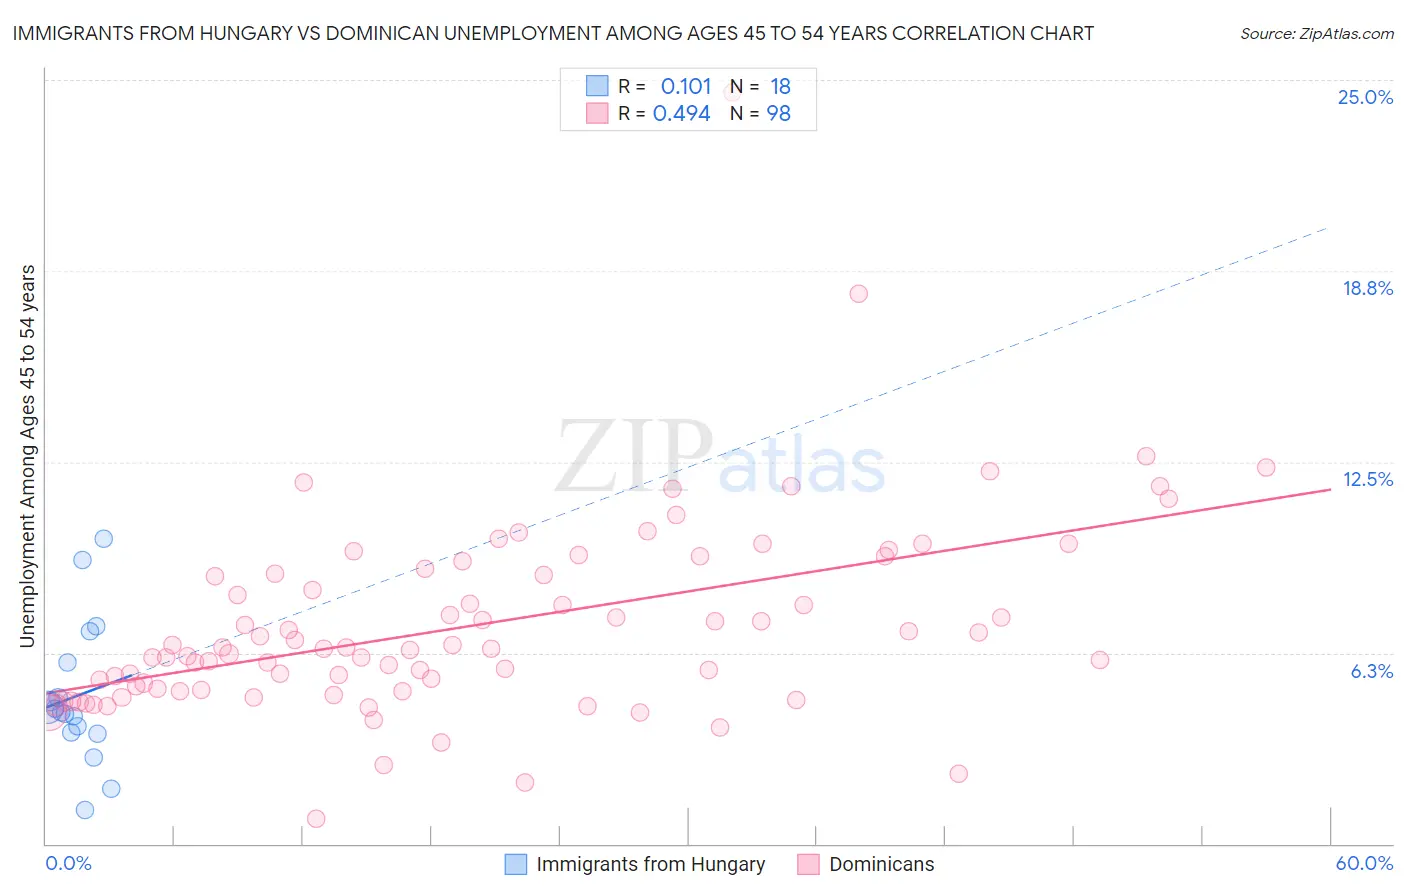
Immigrants from Hungary vs Dominican Unemployment Among Ages 45 to 54 years Correlation Chart
The statistical analysis conducted on geographies consisting of 193,618,917 people shows a poor positive correlation between the proportion of Immigrants from Hungary and unemployment rate among population between the ages 45 and 54 in the United States with a correlation coefficient (R) of 0.101 and weighted average of 4.5%. Similarly, the statistical analysis conducted on geographies consisting of 346,800,593 people shows a moderate positive correlation between the proportion of Dominicans and unemployment rate among population between the ages 45 and 54 in the United States with a correlation coefficient (R) of 0.494 and weighted average of 6.2%, a difference of 37.1%.
Unemployment Among Ages 45 to 54 years Correlation Summary
| Measurement | Immigrants from Hungary | Dominican |
| Minimum | 1.1% | 0.80% |
| Maximum | 10.0% | 24.6% |
| Range | 8.9% | 23.8% |
| Mean | 4.8% | 7.1% |
| Median | 4.4% | 6.4% |
| Interquartile 25% (IQ1) | 3.6% | 5.0% |
| Interquartile 75% (IQ3) | 5.9% | 8.8% |
| Interquartile Range (IQR) | 2.3% | 3.8% |
| Standard Deviation (Sample) | 2.3% | 3.2% |
| Standard Deviation (Population) | 2.2% | 3.2% |
Similar Demographics by Unemployment Among Ages 45 to 54 years
Demographics Similar to Immigrants from Hungary by Unemployment Among Ages 45 to 54 years
In terms of unemployment among ages 45 to 54 years, the demographic groups most similar to Immigrants from Hungary are Immigrants from France (4.5%, a difference of 0.030%), Puget Sound Salish (4.5%, a difference of 0.040%), Immigrants from Northern Africa (4.5%, a difference of 0.050%), Immigrants from Australia (4.5%, a difference of 0.070%), and Immigrants from Russia (4.5%, a difference of 0.080%).
| Demographics | Rating | Rank | Unemployment Among Ages 45 to 54 years |
| Immigrants | Brazil | 56.4 /100 | #167 | Average 4.5% |
| Immigrants | Europe | 54.7 /100 | #168 | Average 4.5% |
| Immigrants | Egypt | 54.7 /100 | #169 | Average 4.5% |
| Spaniards | 54.3 /100 | #170 | Average 4.5% |
| Egyptians | 53.6 /100 | #171 | Average 4.5% |
| Colombians | 53.3 /100 | #172 | Average 4.5% |
| Immigrants | Colombia | 52.0 /100 | #173 | Average 4.5% |
| Immigrants | Hungary | 50.0 /100 | #174 | Average 4.5% |
| Immigrants | France | 49.4 /100 | #175 | Average 4.5% |
| Puget Sound Salish | 49.1 /100 | #176 | Average 4.5% |
| Immigrants | Northern Africa | 49.0 /100 | #177 | Average 4.5% |
| Immigrants | Australia | 48.5 /100 | #178 | Average 4.5% |
| Immigrants | Russia | 48.2 /100 | #179 | Average 4.5% |
| Malaysians | 47.5 /100 | #180 | Average 4.5% |
| Immigrants | Poland | 47.0 /100 | #181 | Average 4.5% |
Demographics Similar to Dominicans by Unemployment Among Ages 45 to 54 years
In terms of unemployment among ages 45 to 54 years, the demographic groups most similar to Dominicans are Ute (6.2%, a difference of 0.21%), Pueblo (6.2%, a difference of 0.21%), Alaska Native (6.3%, a difference of 0.91%), Immigrants from Dominican Republic (6.3%, a difference of 1.0%), and Immigrants from Armenia (6.1%, a difference of 1.1%).
| Demographics | Rating | Rank | Unemployment Among Ages 45 to 54 years |
| Immigrants | St. Vincent and the Grenadines | 0.0 /100 | #320 | Tragic 5.7% |
| Yakama | 0.0 /100 | #321 | Tragic 5.7% |
| Immigrants | Azores | 0.0 /100 | #322 | Tragic 5.7% |
| Immigrants | Cabo Verde | 0.0 /100 | #323 | Tragic 5.9% |
| Natives/Alaskans | 0.0 /100 | #324 | Tragic 6.1% |
| Immigrants | Armenia | 0.0 /100 | #325 | Tragic 6.1% |
| Ute | 0.0 /100 | #326 | Tragic 6.2% |
| Dominicans | 0.0 /100 | #327 | Tragic 6.2% |
| Pueblo | 0.0 /100 | #328 | Tragic 6.2% |
| Alaska Natives | 0.0 /100 | #329 | Tragic 6.3% |
| Immigrants | Dominican Republic | 0.0 /100 | #330 | Tragic 6.3% |
| Tohono O'odham | 0.0 /100 | #331 | Tragic 6.3% |
| Pima | 0.0 /100 | #332 | Tragic 6.4% |
| Immigrants | Yemen | 0.0 /100 | #333 | Tragic 6.5% |
| Sioux | 0.0 /100 | #334 | Tragic 6.6% |