Immigrants from Honduras vs Kiowa Unemployment Among Ages 16 to 19 years

COMPARE

Immigrants from Honduras
Race
Ancestry
AfghanAfricanAlaska NativeAlaskan AthabascanAlbanianAleutAlsatianAmericanApacheArabArapahoArgentineanArmenianAssyrian/Chaldean/SyriacAustralianAustrianBahamianBangladeshiBarbadianBasqueBelgianBelizeanBermudanBhutaneseBlackfeetBolivianBrazilianBritishBritish West IndianBulgarianBurmeseCajunCambodianCanadianCape VerdeanCarpatho RusynCelticCentral AmericanCentral American IndianCherokeeCheyenneChickasawChileanChineseChippewaChoctawColombianColvilleComancheCosta RicanCreeCreekCroatianCrowCubanCypriotCzechCzechoslovakianDanishDelawareDominicanDutchDutch West IndianEastern EuropeanEcuadorianEgyptianEnglishEstonianEthiopianEuropeanFijianFilipinoFinnishFrenchFrench American IndianFrench CanadianGermanGerman RussianGhanaianGreekGuamanian/ChamorroGuatemalanGuyaneseHaitianHmongHonduranHopiHoumaHungarianIcelanderIndian (Asian)IndonesianInupiatIranianIraqiIrishIroquoisIsraeliItalianJamaicanJapaneseJordanianKenyanKoreanLaotianLatvianLebaneseLiberianLithuanianLumbeeLuxembourgerMacedonianMalaysianMalteseMarshalleseMenomineeMexicanMexican American IndianMongolianMoroccanNative HawaiianNavajoNepaleseNew ZealanderNicaraguanNigerianNorthern EuropeanNorwegianOkinawanOsageOttawaPaiutePakistaniPalestinianPanamanianParaguayanPennsylvania GermanPeruvianPimaPolishPortuguesePotawatomiPuebloPuerto RicanPuget Sound SalishRomanianRussianSalvadoranSamoanScandinavianScotch-IrishScottishSeminoleSenegaleseSerbianShoshoneSierra LeoneanSiouxSlavicSlovakSloveneSomaliSouth AfricanSouth AmericanSouth American IndianSoviet UnionSpaniardSpanishSpanish AmericanSpanish American IndianSri LankanSubsaharan AfricanSudaneseSwedishSwissSyrianTaiwaneseThaiTlingit-HaidaTohono O'OdhamTonganTrinidadian and TobagonianTsimshianTurkishU.S. Virgin IslanderUgandanUkrainianUruguayanUteVenezuelanVietnameseWelshWest IndianYakamaYaquiYugoslavianYumanYup'ikZimbabwean
Immigration
NonimmigrantsImmigrantsAfghanistanAfricaAlbaniaArgentinaArmeniaAsiaAustraliaAustriaBahamasBangladeshBarbadosBelarusBelgiumBelizeBoliviaBosnia and HerzegovinaBrazilBulgariaBurma/MyanmarCabo VerdeCambodiaCameroonCanadaCaribbeanCentral AmericaChileChinaColombiaCongoCosta RicaCroatiaCubaCzechoslovakiaDenmarkDominicaDominican RepublicEastern AfricaEastern AsiaEastern EuropeEcuadorEgyptEl SalvadorEnglandEritreaEthiopiaEuropeFijiFranceGermanyGhanaGreeceGrenadaGuatemalaGuyanaHaitiHondurasHong KongHungaryIndiaIndonesiaIranIraqIrelandIsraelItalyJamaicaJapanJordanKazakhstanKenyaKoreaKuwaitLaosLatin AmericaLatviaLebanonLiberiaLithuaniaMalaysiaMexicoMicronesiaMiddle AfricaMoldovaMoroccoNepalNetherlandsNicaraguaNigeriaNorth AmericaNorth MacedoniaNorthern AfricaNorthern EuropeNorwayOceaniaPakistanPanamaPeruPhilippinesPolandPortugalRomaniaRussiaSaudi ArabiaScotlandSenegalSerbiaSierra LeoneSingaporeSomaliaSouth AfricaSouth AmericaSouth Central AsiaSouth Eastern AsiaSouthern EuropeSpainSri LankaSt. Vincent and the GrenadinesSudanSwedenSwitzerlandSyriaTaiwanThailandTrinidad and TobagoTurkeyUgandaUkraineUruguayUzbekistanVenezuelaVietnamWest IndiesWestern AfricaWestern AsiaWestern EuropeYemenZaireZimbabweAzores
Kiowa
Race
Ancestry
AfghanAfricanAlaska NativeAlaskan AthabascanAlbanianAleutAlsatianAmericanApacheArabArapahoArgentineanArmenianAssyrian/Chaldean/SyriacAustralianAustrianBahamianBangladeshiBarbadianBasqueBelgianBelizeanBermudanBhutaneseBlackfeetBolivianBrazilianBritishBritish West IndianBulgarianBurmeseCajunCambodianCanadianCape VerdeanCarpatho RusynCelticCentral AmericanCentral American IndianCherokeeCheyenneChickasawChileanChineseChippewaChoctawColombianColvilleComancheCosta RicanCreeCreekCroatianCrowCubanCypriotCzechCzechoslovakianDanishDelawareDominicanDutchDutch West IndianEastern EuropeanEcuadorianEgyptianEnglishEstonianEthiopianEuropeanFijianFilipinoFinnishFrenchFrench American IndianFrench CanadianGermanGerman RussianGhanaianGreekGuamanian/ChamorroGuatemalanGuyaneseHaitianHmongHonduranHopiHoumaHungarianIcelanderIndian (Asian)IndonesianInupiatIranianIraqiIrishIroquoisIsraeliItalianJamaicanJapaneseJordanianKenyanKiowaKoreanLaotianLatvianLebaneseLiberianLithuanianLumbeeLuxembourgerMacedonianMalaysianMalteseMarshalleseMenomineeMexicanMexican American IndianMongolianMoroccanNative HawaiianNavajoNepaleseNew ZealanderNicaraguanNigerianNorthern EuropeanNorwegianOkinawanOsageOttawaPaiutePakistaniPalestinianPanamanianParaguayanPennsylvania GermanPeruvianPimaPolishPortuguesePotawatomiPuebloPuerto RicanPuget Sound SalishRomanianRussianSalvadoranSamoanScandinavianScotch-IrishScottishSeminoleSenegaleseSerbianShoshoneSierra LeoneanSiouxSlavicSlovakSloveneSomaliSouth AfricanSouth AmericanSouth American IndianSoviet UnionSpaniardSpanishSpanish AmericanSpanish American IndianSri LankanSubsaharan AfricanSudaneseSwedishSwissSyrianTaiwaneseThaiTlingit-HaidaTohono O'OdhamTonganTrinidadian and TobagonianTsimshianTurkishU.S. Virgin IslanderUgandanUkrainianUruguayanUteVenezuelanVietnameseWelshWest IndianYakamaYaquiYugoslavianYumanYup'ikZimbabwean
Immigration
NonimmigrantsImmigrantsAfghanistanAfricaAlbaniaArgentinaArmeniaAsiaAustraliaAustriaBahamasBangladeshBarbadosBelarusBelgiumBelizeBoliviaBosnia and HerzegovinaBrazilBulgariaBurma/MyanmarCabo VerdeCambodiaCameroonCanadaCaribbeanCentral AmericaChileChinaColombiaCongoCosta RicaCroatiaCubaCzechoslovakiaDenmarkDominicaDominican RepublicEastern AfricaEastern AsiaEastern EuropeEcuadorEgyptEl SalvadorEnglandEritreaEthiopiaEuropeFijiFranceGermanyGhanaGreeceGrenadaGuatemalaGuyanaHaitiHong KongHungaryIndiaIndonesiaIranIraqIrelandIsraelItalyJamaicaJapanJordanKazakhstanKenyaKoreaKuwaitLaosLatin AmericaLatviaLebanonLiberiaLithuaniaMalaysiaMexicoMicronesiaMiddle AfricaMoldovaMoroccoNepalNetherlandsNicaraguaNigeriaNorth AmericaNorth MacedoniaNorthern AfricaNorthern EuropeNorwayOceaniaPakistanPanamaPeruPhilippinesPolandPortugalRomaniaRussiaSaudi ArabiaScotlandSenegalSerbiaSierra LeoneSingaporeSomaliaSouth AfricaSouth AmericaSouth Central AsiaSouth Eastern AsiaSouthern EuropeSpainSri LankaSt. Vincent and the GrenadinesSudanSwedenSwitzerlandSyriaTaiwanThailandTrinidad and TobagoTurkeyUgandaUkraineUruguayUzbekistanVenezuelaVietnamWest IndiesWestern AfricaWestern AsiaWestern EuropeYemenZaireZimbabweAzores
Unemployment Among Ages 16 to 19 years
Income
Poverty
Unemployment
Labor Participation
Family Structure
Vehicle Availability
Education Level
Disability

Unemployment Among Ages 16 to 19 years Comparison

Immigrants from Honduras

Kiowa

Tragic
Tragic
19.0%
UNEMPLOYMENT AMONG AGES 16 TO 19 YEARS
0.1/ 100
METRIC RATING
266th/ 347
METRIC RANK
25.2%
UNEMPLOYMENT AMONG AGES 16 TO 19 YEARS
0.0/ 100
METRIC RATING
336th/ 347
METRIC RANK

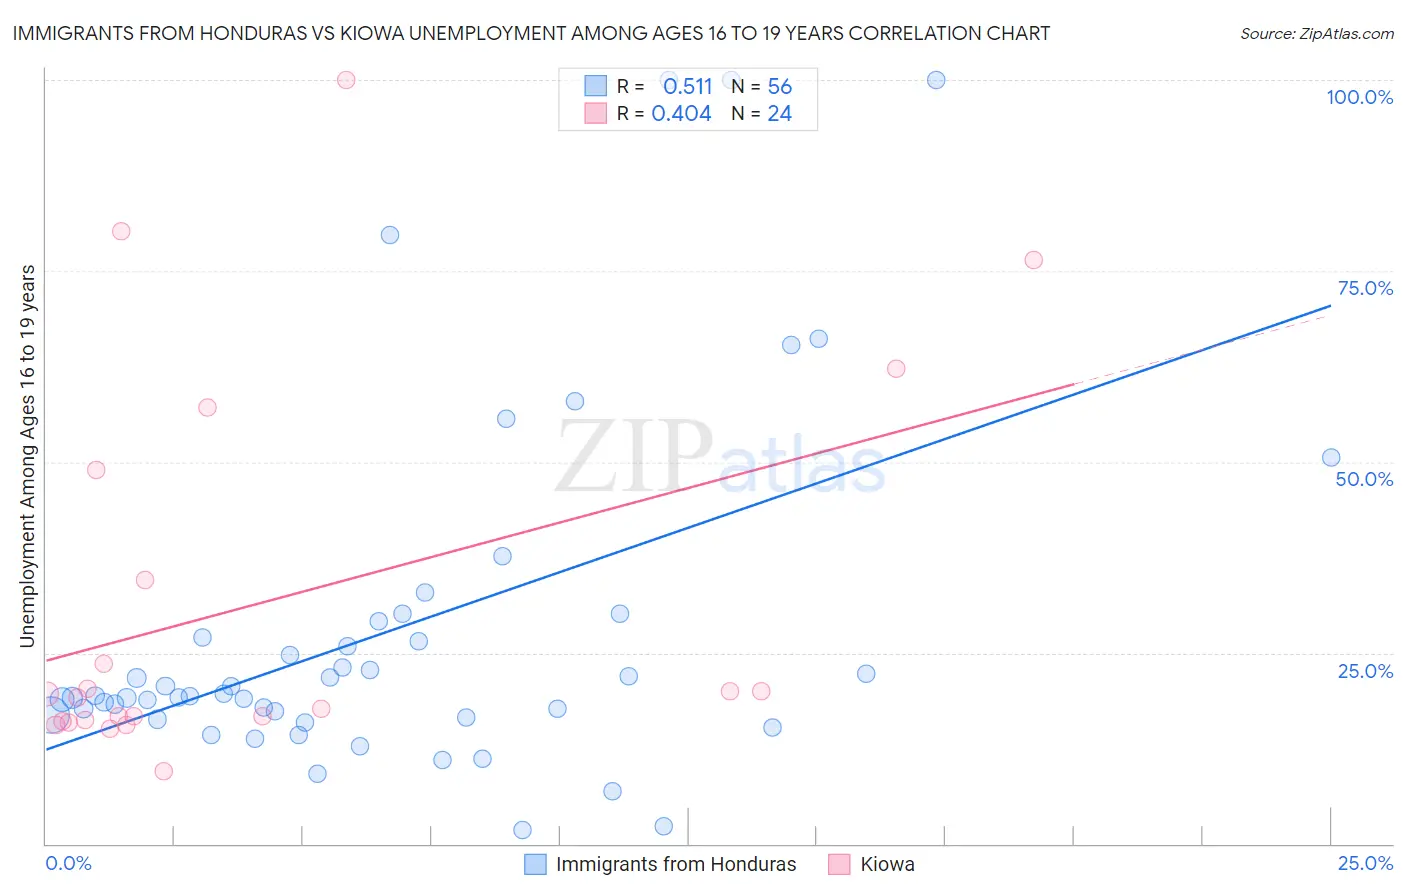
Immigrants from Honduras vs Kiowa Unemployment Among Ages 16 to 19 years Correlation Chart

The statistical analysis conducted on geographies consisting of 310,823,514 people shows a substantial positive correlation between the proportion of Immigrants from Honduras and unemployment rate among population between the ages 16 and 19 in the United States with a correlation coefficient (R) of 0.511 and weighted average of 19.0%. Similarly, the statistical analysis conducted on geographies consisting of 55,446,259 people shows a moderate positive correlation between the proportion of Kiowa and unemployment rate among population between the ages 16 and 19 in the United States with a correlation coefficient (R) of 0.404 and weighted average of 25.2%, a difference of 32.8%.
Immigrants from Honduras vs Kiowa Unemployment Among Ages 16 to 19 years

Unemployment Among Ages 16 to 19 years Correlation Summary

MeasurementImmigrants from HondurasKiowa
Minimum1.8%9.5%
Maximum100.0%100.0%
Range98.2%90.5%
Mean28.1%31.4%
Median19.4%19.4%
Interquartile 25% (IQ1)16.7%16.1%
Interquartile 75% (IQ3)28.0%41.7%
Interquartile Range (IQR)11.4%25.6%
Standard Deviation (Sample)23.1%25.2%
Standard Deviation (Population)22.9%24.6%

Similar Demographics by Unemployment Among Ages 16 to 19 years

Demographics Similar to Immigrants from Honduras by Unemployment Among Ages 16 to 19 years

In terms of unemployment among ages 16 to 19 years, the demographic groups most similar to Immigrants from Honduras are Choctaw (19.0%, a difference of 0.090%), Yaqui (19.0%, a difference of 0.10%), Cree (19.0%, a difference of 0.13%), Salvadoran (18.9%, a difference of 0.26%), and Spanish American Indian (18.9%, a difference of 0.30%).
DemographicsRating | RankUnemployment Among Ages 16 to 19 years
Immigrants | Central America
0.2
/100
|
#259
Tragic
18.9%
Nigerians
0.2
/100
|
#260
Tragic
18.9%
Spanish American Indians
0.1
/100
|
#261
Tragic
18.9%
Salvadorans
0.1
/100
|
#262
Tragic
18.9%
Cree
0.1
/100
|
#263
Tragic
19.0%
Yaqui
0.1
/100
|
#264
Tragic
19.0%
Choctaw
0.1
/100
|
#265
Tragic
19.0%
Immigrants | Honduras
0.1
/100
|
#266
Tragic
19.0%
Israelis
0.1
/100
|
#267
Tragic
19.0%
Immigrants | El Salvador
0.1
/100
|
#268
Tragic
19.1%
Lumbee
0.1
/100
|
#269
Tragic
19.1%
Hondurans
0.1
/100
|
#270
Tragic
19.2%
Blackfeet
0.0
/100
|
#271
Tragic
19.2%
Hispanics or Latinos
0.0
/100
|
#272
Tragic
19.2%
Immigrants | Panama
0.0
/100
|
#273
Tragic
19.3%

Demographics Similar to Kiowa by Unemployment Among Ages 16 to 19 years

In terms of unemployment among ages 16 to 19 years, the demographic groups most similar to Kiowa are Arapaho (25.2%, a difference of 0.21%), Immigrants from Guyana (25.5%, a difference of 1.1%), Guyanese (24.8%, a difference of 1.5%), Immigrants from St. Vincent and the Grenadines (25.7%, a difference of 1.9%), and Immigrants from Grenada (25.7%, a difference of 2.1%).
DemographicsRating | RankUnemployment Among Ages 16 to 19 years
Tlingit-Haida
0.0
/100
|
#329
Tragic
23.5%
Dominicans
0.0
/100
|
#330
Tragic
23.6%
British West Indians
0.0
/100
|
#331
Tragic
24.0%
Immigrants | Barbados
0.0
/100
|
#332
Tragic
24.0%
Paiute
0.0
/100
|
#333
Tragic
24.4%
Guyanese
0.0
/100
|
#334
Tragic
24.8%
Arapaho
0.0
/100
|
#335
Tragic
25.2%
Kiowa
0.0
/100
|
#336
Tragic
25.2%
Immigrants | Guyana
0.0
/100
|
#337
Tragic
25.5%
Immigrants | St. Vincent and the Grenadines
0.0
/100
|
#338
Tragic
25.7%
Immigrants | Grenada
0.0
/100
|
#339
Tragic
25.7%
Crow
0.0
/100
|
#340
Tragic
26.2%
Puerto Ricans
0.0
/100
|
#341
Tragic
27.5%
Inupiat
0.0
/100
|
#342
Tragic
28.1%
Navajo
0.0
/100
|
#343
Tragic
29.0%