Immigrants from Haiti vs Immigrants from Belarus Unemployment Among Ages 55 to 59 years
COMPARE
Immigrants from Haiti
Immigrants from Belarus
Unemployment Among Ages 55 to 59 years
Unemployment Among Ages 55 to 59 years Comparison
Immigrants from Haiti
Immigrants from Belarus
4.9%
UNEMPLOYMENT AMONG AGES 55 TO 59 YEARS
13.3/ 100
METRIC RATING
209th/ 347
METRIC RANK
4.9%
UNEMPLOYMENT AMONG AGES 55 TO 59 YEARS
14.1/ 100
METRIC RATING
206th/ 347
METRIC RANK
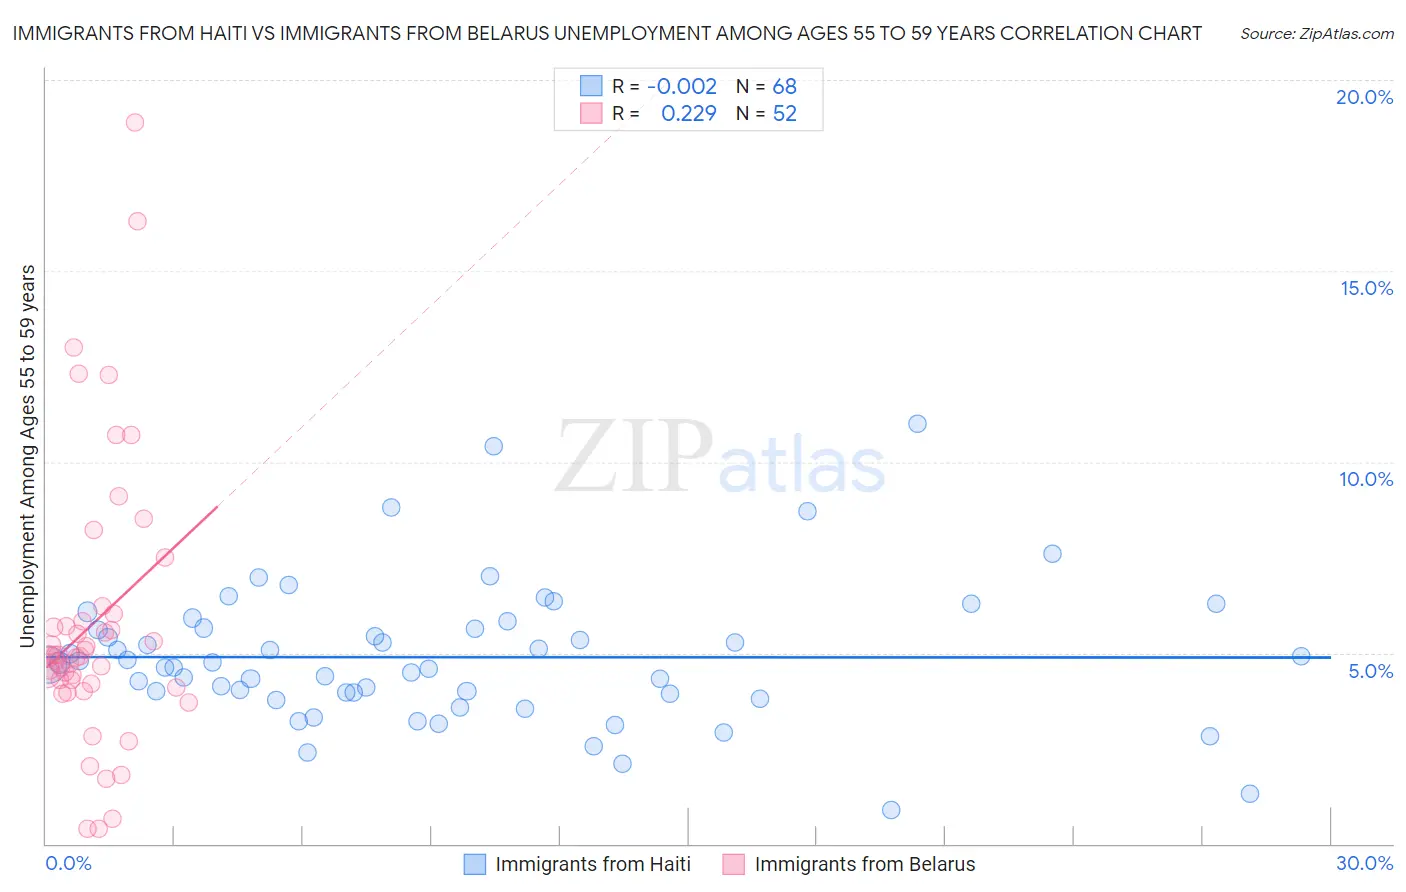
Immigrants from Haiti vs Immigrants from Belarus Unemployment Among Ages 55 to 59 years Correlation Chart
The statistical analysis conducted on geographies consisting of 215,720,652 people shows no correlation between the proportion of Immigrants from Haiti and unemployment rate among population between the ages 55 and 59 in the United States with a correlation coefficient (R) of -0.002 and weighted average of 4.9%. Similarly, the statistical analysis conducted on geographies consisting of 146,548,601 people shows a weak positive correlation between the proportion of Immigrants from Belarus and unemployment rate among population between the ages 55 and 59 in the United States with a correlation coefficient (R) of 0.229 and weighted average of 4.9%, a difference of 0.070%.
Unemployment Among Ages 55 to 59 years Correlation Summary
| Measurement | Immigrants from Haiti | Immigrants from Belarus |
| Minimum | 0.90% | 0.40% |
| Maximum | 11.0% | 18.9% |
| Range | 10.1% | 18.5% |
| Mean | 4.9% | 5.8% |
| Median | 4.7% | 4.9% |
| Interquartile 25% (IQ1) | 3.9% | 4.1% |
| Interquartile 75% (IQ3) | 5.6% | 5.9% |
| Interquartile Range (IQR) | 1.7% | 1.8% |
| Standard Deviation (Sample) | 1.8% | 3.7% |
| Standard Deviation (Population) | 1.8% | 3.6% |
Demographics Similar to Immigrants from Haiti and Immigrants from Belarus by Unemployment Among Ages 55 to 59 years
In terms of unemployment among ages 55 to 59 years, the demographic groups most similar to Immigrants from Haiti are Creek (4.9%, a difference of 0.030%), Hawaiian (4.9%, a difference of 0.040%), Immigrants from Kazakhstan (4.9%, a difference of 0.060%), Immigrants from Australia (4.9%, a difference of 0.070%), and Nonimmigrants (4.9%, a difference of 0.20%). Similarly, the demographic groups most similar to Immigrants from Belarus are Immigrants from Australia (4.9%, a difference of 0.0%), Immigrants from Kazakhstan (4.9%, a difference of 0.010%), Creek (4.9%, a difference of 0.10%), Hawaiian (4.9%, a difference of 0.11%), and Nonimmigrants (4.9%, a difference of 0.27%).
| Demographics | Rating | Rank | Unemployment Among Ages 55 to 59 years |
| Macedonians | 26.4 /100 | #197 | Fair 4.9% |
| Immigrants | Philippines | 26.1 /100 | #198 | Fair 4.9% |
| Immigrants | Russia | 23.7 /100 | #199 | Fair 4.9% |
| Basques | 23.3 /100 | #200 | Fair 4.9% |
| Immigrants | South America | 23.1 /100 | #201 | Fair 4.9% |
| Lumbee | 22.5 /100 | #202 | Fair 4.9% |
| Guamanians/Chamorros | 20.8 /100 | #203 | Fair 4.9% |
| Immigrants | Latvia | 18.5 /100 | #204 | Poor 4.9% |
| Haitians | 18.1 /100 | #205 | Poor 4.9% |
| Immigrants | Belarus | 14.1 /100 | #206 | Poor 4.9% |
| Immigrants | Australia | 14.1 /100 | #207 | Poor 4.9% |
| Immigrants | Kazakhstan | 14.0 /100 | #208 | Poor 4.9% |
| Immigrants | Haiti | 13.3 /100 | #209 | Poor 4.9% |
| Creek | 12.9 /100 | #210 | Poor 4.9% |
| Hawaiians | 12.8 /100 | #211 | Poor 4.9% |
| Immigrants | Nonimmigrants | 11.2 /100 | #212 | Poor 4.9% |
| Bermudans | 11.0 /100 | #213 | Poor 4.9% |
| Immigrants | Denmark | 10.3 /100 | #214 | Poor 4.9% |
| Syrians | 8.6 /100 | #215 | Tragic 4.9% |
| Spanish Americans | 8.1 /100 | #216 | Tragic 4.9% |
| Immigrants | Brazil | 8.1 /100 | #217 | Tragic 4.9% |