Immigrants from Guyana vs Bangladeshi Unemployment Among Ages 45 to 54 years
COMPARE
Immigrants from Guyana
Bangladeshi
Unemployment Among Ages 45 to 54 years
Unemployment Among Ages 45 to 54 years Comparison
Immigrants from Guyana
Bangladeshis
5.6%
UNEMPLOYMENT AMONG AGES 45 TO 54 YEARS
0.0/ 100
METRIC RATING
316th/ 347
METRIC RANK
4.5%
UNEMPLOYMENT AMONG AGES 45 TO 54 YEARS
59.7/ 100
METRIC RATING
163rd/ 347
METRIC RANK
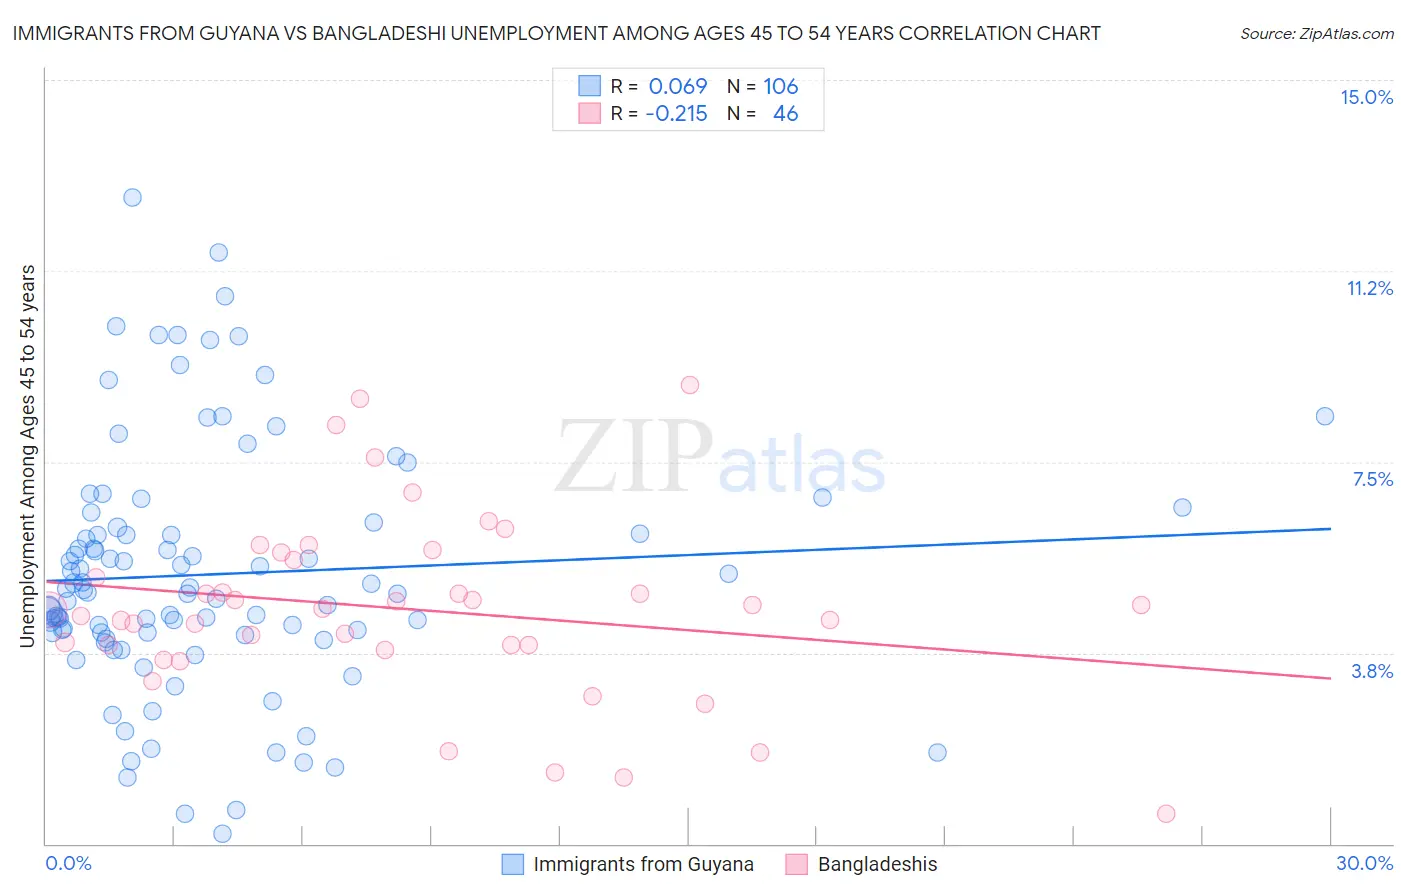
Immigrants from Guyana vs Bangladeshi Unemployment Among Ages 45 to 54 years Correlation Chart
The statistical analysis conducted on geographies consisting of 181,592,956 people shows a slight positive correlation between the proportion of Immigrants from Guyana and unemployment rate among population between the ages 45 and 54 in the United States with a correlation coefficient (R) of 0.069 and weighted average of 5.6%. Similarly, the statistical analysis conducted on geographies consisting of 139,604,321 people shows a weak negative correlation between the proportion of Bangladeshis and unemployment rate among population between the ages 45 and 54 in the United States with a correlation coefficient (R) of -0.215 and weighted average of 4.5%, a difference of 25.0%.
Unemployment Among Ages 45 to 54 years Correlation Summary
| Measurement | Immigrants from Guyana | Bangladeshi |
| Minimum | 0.20% | 0.60% |
| Maximum | 12.7% | 9.0% |
| Range | 12.5% | 8.4% |
| Mean | 5.3% | 4.6% |
| Median | 5.0% | 4.6% |
| Interquartile 25% (IQ1) | 4.1% | 3.9% |
| Interquartile 75% (IQ3) | 6.2% | 5.6% |
| Interquartile Range (IQR) | 2.1% | 1.7% |
| Standard Deviation (Sample) | 2.4% | 1.8% |
| Standard Deviation (Population) | 2.4% | 1.8% |
Similar Demographics by Unemployment Among Ages 45 to 54 years
Demographics Similar to Immigrants from Guyana by Unemployment Among Ages 45 to 54 years
In terms of unemployment among ages 45 to 54 years, the demographic groups most similar to Immigrants from Guyana are Houma (5.6%, a difference of 0.10%), Immigrants from Dominica (5.6%, a difference of 0.20%), Guyanese (5.6%, a difference of 0.38%), Shoshone (5.6%, a difference of 0.71%), and British West Indian (5.7%, a difference of 0.72%).
| Demographics | Rating | Rank | Unemployment Among Ages 45 to 54 years |
| Barbadians | 0.0 /100 | #309 | Tragic 5.5% |
| Immigrants | Barbados | 0.0 /100 | #310 | Tragic 5.5% |
| Chippewa | 0.0 /100 | #311 | Tragic 5.5% |
| Immigrants | Grenada | 0.0 /100 | #312 | Tragic 5.6% |
| Shoshone | 0.0 /100 | #313 | Tragic 5.6% |
| Guyanese | 0.0 /100 | #314 | Tragic 5.6% |
| Immigrants | Dominica | 0.0 /100 | #315 | Tragic 5.6% |
| Immigrants | Guyana | 0.0 /100 | #316 | Tragic 5.6% |
| Houma | 0.0 /100 | #317 | Tragic 5.6% |
| British West Indians | 0.0 /100 | #318 | Tragic 5.7% |
| Cape Verdeans | 0.0 /100 | #319 | Tragic 5.7% |
| Immigrants | St. Vincent and the Grenadines | 0.0 /100 | #320 | Tragic 5.7% |
| Yakama | 0.0 /100 | #321 | Tragic 5.7% |
| Immigrants | Azores | 0.0 /100 | #322 | Tragic 5.7% |
| Immigrants | Cabo Verde | 0.0 /100 | #323 | Tragic 5.9% |
Demographics Similar to Bangladeshis by Unemployment Among Ages 45 to 54 years
In terms of unemployment among ages 45 to 54 years, the demographic groups most similar to Bangladeshis are Immigrants from Indonesia (4.5%, a difference of 0.030%), Samoan (4.5%, a difference of 0.060%), Immigrants from Eastern Europe (4.5%, a difference of 0.090%), Maltese (4.5%, a difference of 0.090%), and Immigrants from South Eastern Asia (4.5%, a difference of 0.11%).
| Demographics | Rating | Rank | Unemployment Among Ages 45 to 54 years |
| Immigrants | Croatia | 69.6 /100 | #156 | Good 4.5% |
| Indians (Asian) | 68.1 /100 | #157 | Good 4.5% |
| Immigrants | Italy | 65.5 /100 | #158 | Good 4.5% |
| Immigrants | Nonimmigrants | 62.8 /100 | #159 | Good 4.5% |
| Immigrants | South Eastern Asia | 62.0 /100 | #160 | Good 4.5% |
| Immigrants | Eastern Europe | 61.6 /100 | #161 | Good 4.5% |
| Immigrants | Indonesia | 60.3 /100 | #162 | Good 4.5% |
| Bangladeshis | 59.7 /100 | #163 | Average 4.5% |
| Samoans | 58.5 /100 | #164 | Average 4.5% |
| Maltese | 57.9 /100 | #165 | Average 4.5% |
| Immigrants | Western Europe | 57.4 /100 | #166 | Average 4.5% |
| Immigrants | Brazil | 56.4 /100 | #167 | Average 4.5% |
| Immigrants | Europe | 54.7 /100 | #168 | Average 4.5% |
| Immigrants | Egypt | 54.7 /100 | #169 | Average 4.5% |
| Spaniards | 54.3 /100 | #170 | Average 4.5% |