Immigrants from Guatemala vs Serbian Unemployment Among Women with Children Under 6 years
COMPARE
Immigrants from Guatemala
Serbian
Unemployment Among Women with Children Under 6 years
Unemployment Among Women with Children Under 6 years Comparison
Immigrants from Guatemala
Serbians
8.6%
UNEMPLOYMENT AMONG WOMEN WITH CHILDREN UNDER 6 YEARS
0.0/ 100
METRIC RATING
279th/ 347
METRIC RANK
7.3%
UNEMPLOYMENT AMONG WOMEN WITH CHILDREN UNDER 6 YEARS
94.5/ 100
METRIC RATING
118th/ 347
METRIC RANK
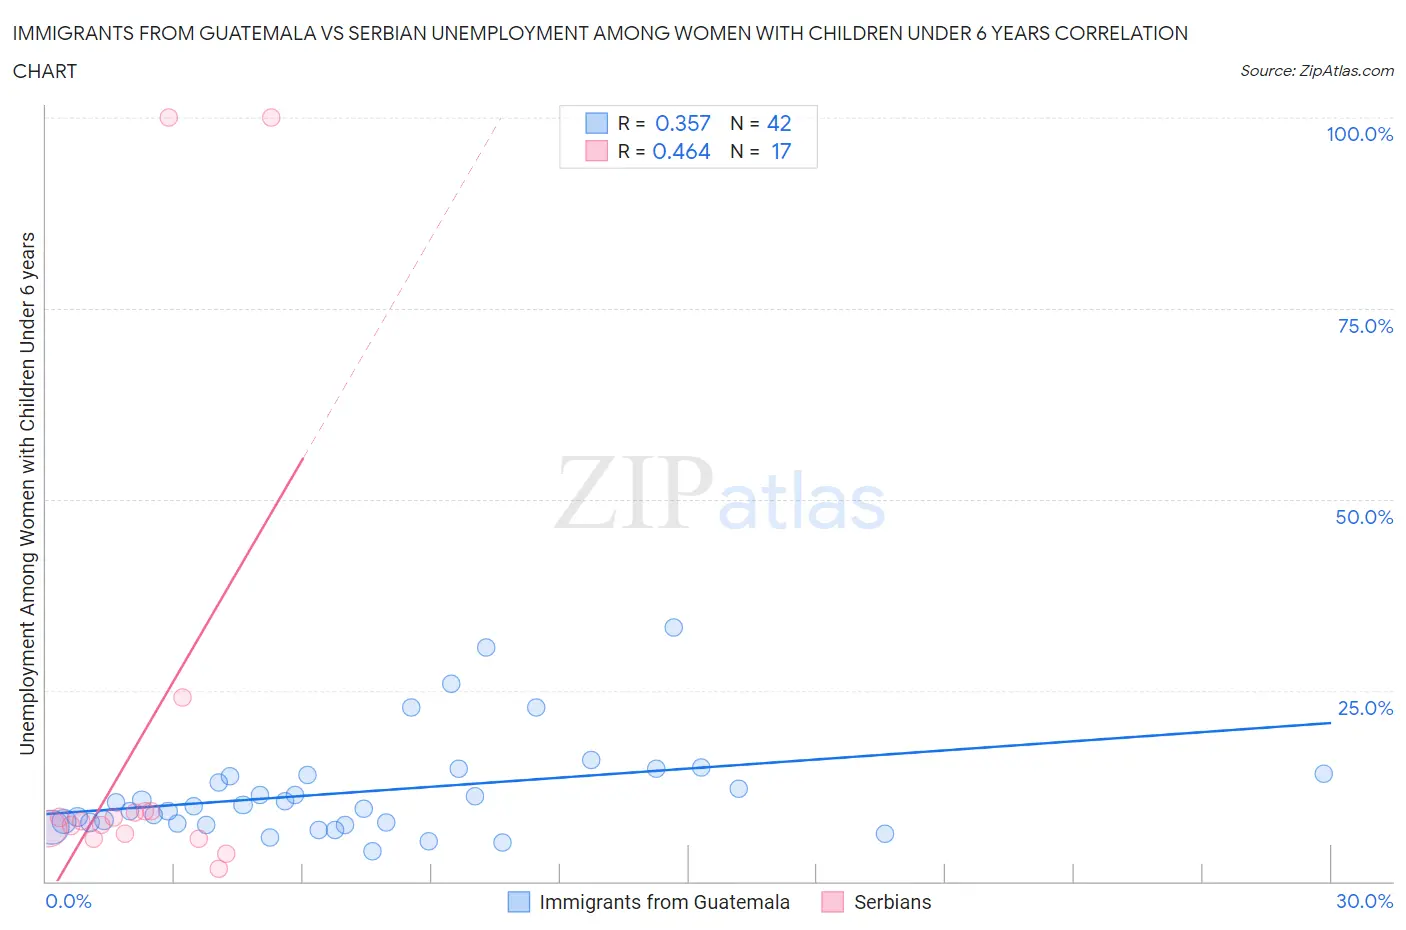
Immigrants from Guatemala vs Serbian Unemployment Among Women with Children Under 6 years Correlation Chart
The statistical analysis conducted on geographies consisting of 295,209,480 people shows a mild positive correlation between the proportion of Immigrants from Guatemala and unemployment rate among women with children under the age of 6 in the United States with a correlation coefficient (R) of 0.357 and weighted average of 8.6%. Similarly, the statistical analysis conducted on geographies consisting of 212,728,717 people shows a moderate positive correlation between the proportion of Serbians and unemployment rate among women with children under the age of 6 in the United States with a correlation coefficient (R) of 0.464 and weighted average of 7.3%, a difference of 18.6%.
Unemployment Among Women with Children Under 6 years Correlation Summary
| Measurement | Immigrants from Guatemala | Serbian |
| Minimum | 4.0% | 1.6% |
| Maximum | 33.3% | 100.0% |
| Range | 29.3% | 98.4% |
| Mean | 11.7% | 18.8% |
| Median | 9.9% | 7.9% |
| Interquartile 25% (IQ1) | 7.6% | 5.9% |
| Interquartile 75% (IQ3) | 13.9% | 9.1% |
| Interquartile Range (IQR) | 6.3% | 3.2% |
| Standard Deviation (Sample) | 6.6% | 30.9% |
| Standard Deviation (Population) | 6.5% | 30.0% |
Similar Demographics by Unemployment Among Women with Children Under 6 years
Demographics Similar to Immigrants from Guatemala by Unemployment Among Women with Children Under 6 years
In terms of unemployment among women with children under 6 years, the demographic groups most similar to Immigrants from Guatemala are Immigrants from Dominica (8.6%, a difference of 0.010%), Immigrants from Belize (8.6%, a difference of 0.040%), Guatemalan (8.7%, a difference of 0.18%), Bermudan (8.7%, a difference of 0.27%), and Haitian (8.6%, a difference of 0.29%).
| Demographics | Rating | Rank | Unemployment Among Women with Children Under 6 years |
| Mexican American Indians | 0.1 /100 | #272 | Tragic 8.5% |
| Slovaks | 0.1 /100 | #273 | Tragic 8.5% |
| Immigrants | Cameroon | 0.1 /100 | #274 | Tragic 8.6% |
| Immigrants | Latin America | 0.1 /100 | #275 | Tragic 8.6% |
| Yaqui | 0.0 /100 | #276 | Tragic 8.6% |
| Haitians | 0.0 /100 | #277 | Tragic 8.6% |
| Immigrants | Dominica | 0.0 /100 | #278 | Tragic 8.6% |
| Immigrants | Guatemala | 0.0 /100 | #279 | Tragic 8.6% |
| Immigrants | Belize | 0.0 /100 | #280 | Tragic 8.6% |
| Guatemalans | 0.0 /100 | #281 | Tragic 8.7% |
| Bermudans | 0.0 /100 | #282 | Tragic 8.7% |
| Spanish American Indians | 0.0 /100 | #283 | Tragic 8.7% |
| Blackfeet | 0.0 /100 | #284 | Tragic 8.7% |
| U.S. Virgin Islanders | 0.0 /100 | #285 | Tragic 8.7% |
| Seminole | 0.0 /100 | #286 | Tragic 8.7% |
Demographics Similar to Serbians by Unemployment Among Women with Children Under 6 years
In terms of unemployment among women with children under 6 years, the demographic groups most similar to Serbians are South African (7.3%, a difference of 0.11%), Iraqi (7.3%, a difference of 0.18%), Immigrants from Chile (7.3%, a difference of 0.30%), Immigrants from Bosnia and Herzegovina (7.3%, a difference of 0.31%), and Immigrants from Kenya (7.3%, a difference of 0.33%).
| Demographics | Rating | Rank | Unemployment Among Women with Children Under 6 years |
| Norwegians | 96.7 /100 | #111 | Exceptional 7.2% |
| Israelis | 96.5 /100 | #112 | Exceptional 7.2% |
| Nicaraguans | 96.3 /100 | #113 | Exceptional 7.2% |
| Argentineans | 96.2 /100 | #114 | Exceptional 7.2% |
| Immigrants | Italy | 96.1 /100 | #115 | Exceptional 7.2% |
| Armenians | 95.9 /100 | #116 | Exceptional 7.2% |
| Immigrants | Kenya | 95.4 /100 | #117 | Exceptional 7.3% |
| Serbians | 94.5 /100 | #118 | Exceptional 7.3% |
| South Africans | 94.1 /100 | #119 | Exceptional 7.3% |
| Iraqis | 93.9 /100 | #120 | Exceptional 7.3% |
| Immigrants | Chile | 93.5 /100 | #121 | Exceptional 7.3% |
| Immigrants | Bosnia and Herzegovina | 93.5 /100 | #122 | Exceptional 7.3% |
| Immigrants | Zaire | 93.3 /100 | #123 | Exceptional 7.3% |
| Immigrants | South Africa | 92.5 /100 | #124 | Exceptional 7.3% |
| Pakistanis | 92.2 /100 | #125 | Exceptional 7.3% |