Immigrants from Grenada vs Mexican Unemployment Among Ages 45 to 54 years

COMPARE

Immigrants from Grenada
Race
Ancestry
AfghanAfricanAlaska NativeAlaskan AthabascanAlbanianAleutAlsatianAmericanApacheArabArapahoArgentineanArmenianAssyrian/Chaldean/SyriacAustralianAustrianBahamianBangladeshiBarbadianBasqueBelgianBelizeanBermudanBhutaneseBlackfeetBolivianBrazilianBritishBritish West IndianBulgarianBurmeseCajunCambodianCanadianCape VerdeanCarpatho RusynCelticCentral AmericanCentral American IndianCherokeeCheyenneChickasawChileanChineseChippewaChoctawColombianColvilleComancheCosta RicanCreeCreekCroatianCrowCubanCypriotCzechCzechoslovakianDanishDelawareDominicanDutchDutch West IndianEastern EuropeanEcuadorianEgyptianEnglishEstonianEthiopianEuropeanFijianFilipinoFinnishFrenchFrench American IndianFrench CanadianGermanGerman RussianGhanaianGreekGuamanian/ChamorroGuatemalanGuyaneseHaitianHmongHonduranHopiHoumaHungarianIcelanderIndian (Asian)IndonesianInupiatIranianIraqiIrishIroquoisIsraeliItalianJamaicanJapaneseJordanianKenyanKiowaKoreanLaotianLatvianLebaneseLiberianLithuanianLumbeeLuxembourgerMacedonianMalaysianMalteseMarshalleseMenomineeMexican American IndianMongolianMoroccanNative HawaiianNavajoNepaleseNew ZealanderNicaraguanNigerianNorthern EuropeanNorwegianOkinawanOsageOttawaPaiutePakistaniPalestinianPanamanianParaguayanPennsylvania GermanPeruvianPimaPolishPortuguesePotawatomiPuebloPuerto RicanPuget Sound SalishRomanianRussianSalvadoranSamoanScandinavianScotch-IrishScottishSeminoleSenegaleseSerbianShoshoneSierra LeoneanSiouxSlavicSlovakSloveneSomaliSouth AfricanSouth AmericanSouth American IndianSoviet UnionSpaniardSpanishSpanish AmericanSpanish American IndianSri LankanSubsaharan AfricanSudaneseSwedishSwissSyrianTaiwaneseThaiTlingit-HaidaTohono O'OdhamTonganTrinidadian and TobagonianTsimshianTurkishU.S. Virgin IslanderUgandanUkrainianUruguayanUteVenezuelanVietnameseWelshWest IndianYakamaYaquiYugoslavianYumanYup'ikZimbabwean
Immigration
NonimmigrantsImmigrantsAfghanistanAfricaAlbaniaArgentinaArmeniaAsiaAustraliaAustriaBahamasBangladeshBarbadosBelarusBelgiumBelizeBoliviaBosnia and HerzegovinaBrazilBulgariaBurma/MyanmarCabo VerdeCambodiaCameroonCanadaCaribbeanCentral AmericaChileChinaColombiaCongoCosta RicaCroatiaCubaCzechoslovakiaDenmarkDominicaDominican RepublicEastern AfricaEastern AsiaEastern EuropeEcuadorEgyptEl SalvadorEnglandEritreaEthiopiaEuropeFijiFranceGermanyGhanaGreeceGrenadaGuatemalaGuyanaHaitiHondurasHong KongHungaryIndiaIndonesiaIranIraqIrelandIsraelItalyJamaicaJapanJordanKazakhstanKenyaKoreaKuwaitLaosLatin AmericaLatviaLebanonLiberiaLithuaniaMalaysiaMexicoMicronesiaMiddle AfricaMoldovaMoroccoNepalNetherlandsNicaraguaNigeriaNorth AmericaNorth MacedoniaNorthern AfricaNorthern EuropeNorwayOceaniaPakistanPanamaPeruPhilippinesPolandPortugalRomaniaRussiaSaudi ArabiaScotlandSenegalSerbiaSierra LeoneSingaporeSomaliaSouth AfricaSouth AmericaSouth Central AsiaSouth Eastern AsiaSouthern EuropeSpainSri LankaSt. Vincent and the GrenadinesSudanSwedenSwitzerlandSyriaTaiwanThailandTrinidad and TobagoTurkeyUgandaUkraineUruguayUzbekistanVenezuelaVietnamWest IndiesWestern AfricaWestern AsiaWestern EuropeYemenZaireZimbabweAzores
Mexican
Race
Ancestry
AfghanAfricanAlaska NativeAlaskan AthabascanAlbanianAleutAlsatianAmericanApacheArabArapahoArgentineanArmenianAssyrian/Chaldean/SyriacAustralianAustrianBahamianBangladeshiBarbadianBasqueBelgianBelizeanBermudanBhutaneseBlackfeetBolivianBrazilianBritishBritish West IndianBulgarianBurmeseCajunCambodianCanadianCape VerdeanCarpatho RusynCelticCentral AmericanCentral American IndianCherokeeCheyenneChickasawChileanChineseChippewaChoctawColombianColvilleComancheCosta RicanCreeCreekCroatianCrowCubanCypriotCzechCzechoslovakianDanishDelawareDominicanDutchDutch West IndianEastern EuropeanEcuadorianEgyptianEnglishEstonianEthiopianEuropeanFijianFilipinoFinnishFrenchFrench American IndianFrench CanadianGermanGerman RussianGhanaianGreekGuamanian/ChamorroGuatemalanGuyaneseHaitianHmongHonduranHopiHoumaHungarianIcelanderIndian (Asian)IndonesianInupiatIranianIraqiIrishIroquoisIsraeliItalianJamaicanJapaneseJordanianKenyanKiowaKoreanLaotianLatvianLebaneseLiberianLithuanianLumbeeLuxembourgerMacedonianMalaysianMalteseMarshalleseMenomineeMexicanMexican American IndianMongolianMoroccanNative HawaiianNavajoNepaleseNew ZealanderNicaraguanNigerianNorthern EuropeanNorwegianOkinawanOsageOttawaPaiutePakistaniPalestinianPanamanianParaguayanPennsylvania GermanPeruvianPimaPolishPortuguesePotawatomiPuebloPuerto RicanPuget Sound SalishRomanianRussianSalvadoranSamoanScandinavianScotch-IrishScottishSeminoleSenegaleseSerbianShoshoneSierra LeoneanSiouxSlavicSlovakSloveneSomaliSouth AfricanSouth AmericanSouth American IndianSoviet UnionSpaniardSpanishSpanish AmericanSpanish American IndianSri LankanSubsaharan AfricanSudaneseSwedishSwissSyrianTaiwaneseThaiTlingit-HaidaTohono O'OdhamTonganTrinidadian and TobagonianTsimshianTurkishU.S. Virgin IslanderUgandanUkrainianUruguayanUteVenezuelanVietnameseWelshWest IndianYakamaYaquiYugoslavianYumanYup'ikZimbabwean
Immigration
NonimmigrantsImmigrantsAfghanistanAfricaAlbaniaArgentinaArmeniaAsiaAustraliaAustriaBahamasBangladeshBarbadosBelarusBelgiumBelizeBoliviaBosnia and HerzegovinaBrazilBulgariaBurma/MyanmarCabo VerdeCambodiaCameroonCanadaCaribbeanCentral AmericaChileChinaColombiaCongoCosta RicaCroatiaCubaCzechoslovakiaDenmarkDominicaDominican RepublicEastern AfricaEastern AsiaEastern EuropeEcuadorEgyptEl SalvadorEnglandEritreaEthiopiaEuropeFijiFranceGermanyGhanaGreeceGuatemalaGuyanaHaitiHondurasHong KongHungaryIndiaIndonesiaIranIraqIrelandIsraelItalyJamaicaJapanJordanKazakhstanKenyaKoreaKuwaitLaosLatin AmericaLatviaLebanonLiberiaLithuaniaMalaysiaMexicoMicronesiaMiddle AfricaMoldovaMoroccoNepalNetherlandsNicaraguaNigeriaNorth AmericaNorth MacedoniaNorthern AfricaNorthern EuropeNorwayOceaniaPakistanPanamaPeruPhilippinesPolandPortugalRomaniaRussiaSaudi ArabiaScotlandSenegalSerbiaSierra LeoneSingaporeSomaliaSouth AfricaSouth AmericaSouth Central AsiaSouth Eastern AsiaSouthern EuropeSpainSri LankaSt. Vincent and the GrenadinesSudanSwedenSwitzerlandSyriaTaiwanThailandTrinidad and TobagoTurkeyUgandaUkraineUruguayUzbekistanVenezuelaVietnamWest IndiesWestern AfricaWestern AsiaWestern EuropeYemenZaireZimbabweAzores
Unemployment Among Ages 45 to 54 years
Income
Poverty
Unemployment
Labor Participation
Family Structure
Vehicle Availability
Education Level
Disability

Unemployment Among Ages 45 to 54 years Comparison

Immigrants from Grenada

Mexicans

Tragic
Tragic
5.6%
UNEMPLOYMENT AMONG AGES 45 TO 54 YEARS
0.0/ 100
METRIC RATING
312th/ 347
METRIC RANK
4.9%
UNEMPLOYMENT AMONG AGES 45 TO 54 YEARS
0.1/ 100
METRIC RATING
262nd/ 347
METRIC RANK

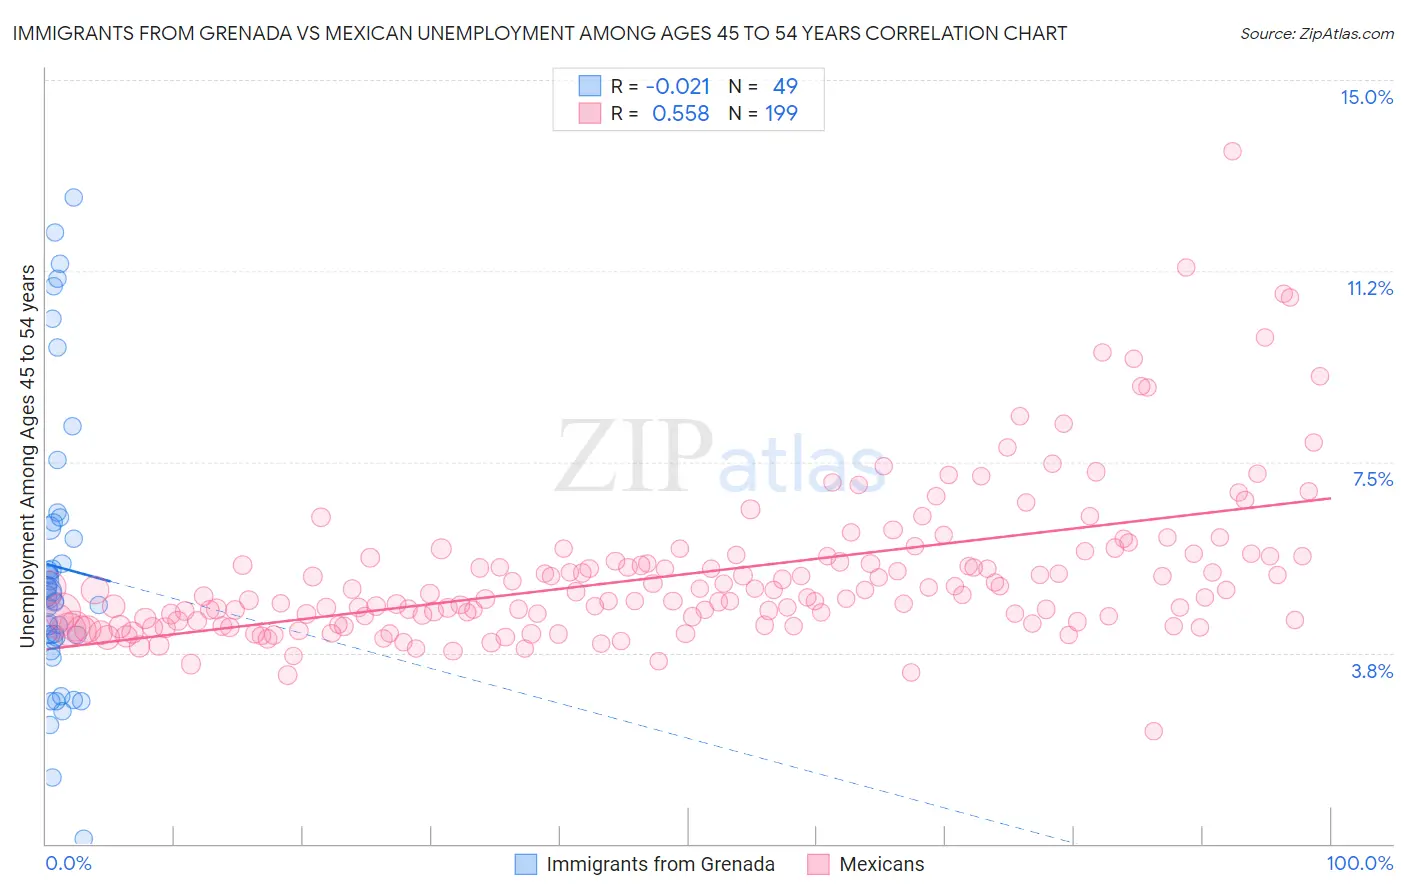
Immigrants from Grenada vs Mexican Unemployment Among Ages 45 to 54 years Correlation Chart

The statistical analysis conducted on geographies consisting of 66,925,701 people shows no correlation between the proportion of Immigrants from Grenada and unemployment rate among population between the ages 45 and 54 in the United States with a correlation coefficient (R) of -0.021 and weighted average of 5.6%. Similarly, the statistical analysis conducted on geographies consisting of 526,378,412 people shows a substantial positive correlation between the proportion of Mexicans and unemployment rate among population between the ages 45 and 54 in the United States with a correlation coefficient (R) of 0.558 and weighted average of 4.9%, a difference of 14.5%.
Immigrants from Grenada vs Mexican Unemployment Among Ages 45 to 54 years

Unemployment Among Ages 45 to 54 years Correlation Summary

MeasurementImmigrants from GrenadaMexican
Minimum0.10%2.2%
Maximum12.7%13.6%
Range12.6%11.4%
Mean5.4%5.3%
Median4.9%4.9%
Interquartile 25% (IQ1)4.0%4.4%
Interquartile 75% (IQ3)6.3%5.6%
Interquartile Range (IQR)2.2%1.3%
Standard Deviation (Sample)2.8%1.5%
Standard Deviation (Population)2.8%1.5%

Similar Demographics by Unemployment Among Ages 45 to 54 years

Demographics Similar to Immigrants from Grenada by Unemployment Among Ages 45 to 54 years

In terms of unemployment among ages 45 to 54 years, the demographic groups most similar to Immigrants from Grenada are Shoshone (5.6%, a difference of 0.040%), Guyanese (5.6%, a difference of 0.37%), Immigrants from Dominica (5.6%, a difference of 0.55%), Immigrants from Guyana (5.6%, a difference of 0.76%), and Houma (5.6%, a difference of 0.85%).
DemographicsRating | RankUnemployment Among Ages 45 to 54 years
Immigrants | West Indies
0.0
/100
|
#305
Tragic
5.4%
Immigrants | Bangladesh
0.0
/100
|
#306
Tragic
5.4%
Vietnamese
0.0
/100
|
#307
Tragic
5.4%
Blacks/African Americans
0.0
/100
|
#308
Tragic
5.4%
Barbadians
0.0
/100
|
#309
Tragic
5.5%
Immigrants | Barbados
0.0
/100
|
#310
Tragic
5.5%
Chippewa
0.0
/100
|
#311
Tragic
5.5%
Immigrants | Grenada
0.0
/100
|
#312
Tragic
5.6%
Shoshone
0.0
/100
|
#313
Tragic
5.6%
Guyanese
0.0
/100
|
#314
Tragic
5.6%
Immigrants | Dominica
0.0
/100
|
#315
Tragic
5.6%
Immigrants | Guyana
0.0
/100
|
#316
Tragic
5.6%
Houma
0.0
/100
|
#317
Tragic
5.6%
British West Indians
0.0
/100
|
#318
Tragic
5.7%
Cape Verdeans
0.0
/100
|
#319
Tragic
5.7%

Demographics Similar to Mexicans by Unemployment Among Ages 45 to 54 years

In terms of unemployment among ages 45 to 54 years, the demographic groups most similar to Mexicans are Mexican American Indian (4.9%, a difference of 0.24%), Guatemalan (4.9%, a difference of 0.24%), Ugandan (4.9%, a difference of 0.25%), Subsaharan African (4.9%, a difference of 0.40%), and Immigrants from Fiji (4.9%, a difference of 0.40%).
DemographicsRating | RankUnemployment Among Ages 45 to 54 years
Immigrants | El Salvador
0.2
/100
|
#255
Tragic
4.8%
Immigrants | Western Asia
0.2
/100
|
#256
Tragic
4.8%
Immigrants | Western Africa
0.2
/100
|
#257
Tragic
4.9%
Sub-Saharan Africans
0.2
/100
|
#258
Tragic
4.9%
Ugandans
0.1
/100
|
#259
Tragic
4.9%
Mexican American Indians
0.1
/100
|
#260
Tragic
4.9%
Guatemalans
0.1
/100
|
#261
Tragic
4.9%
Mexicans
0.1
/100
|
#262
Tragic
4.9%
Immigrants | Fiji
0.1
/100
|
#263
Tragic
4.9%
Immigrants | Guatemala
0.1
/100
|
#264
Tragic
4.9%
Immigrants | Somalia
0.1
/100
|
#265
Tragic
4.9%
Ghanaians
0.0
/100
|
#266
Tragic
4.9%
Bahamians
0.0
/100
|
#267
Tragic
4.9%
Immigrants | Uzbekistan
0.0
/100
|
#268
Tragic
4.9%
Somalis
0.0
/100
|
#269
Tragic
5.0%