Immigrants from Grenada vs Indonesian Unemployment
COMPARE
Immigrants from Grenada
Indonesian
Unemployment
Unemployment Comparison
Immigrants from Grenada
Indonesians
6.9%
UNEMPLOYMENT
0.0/ 100
METRIC RATING
323rd/ 347
METRIC RANK
5.1%
UNEMPLOYMENT
82.3/ 100
METRIC RATING
144th/ 347
METRIC RANK
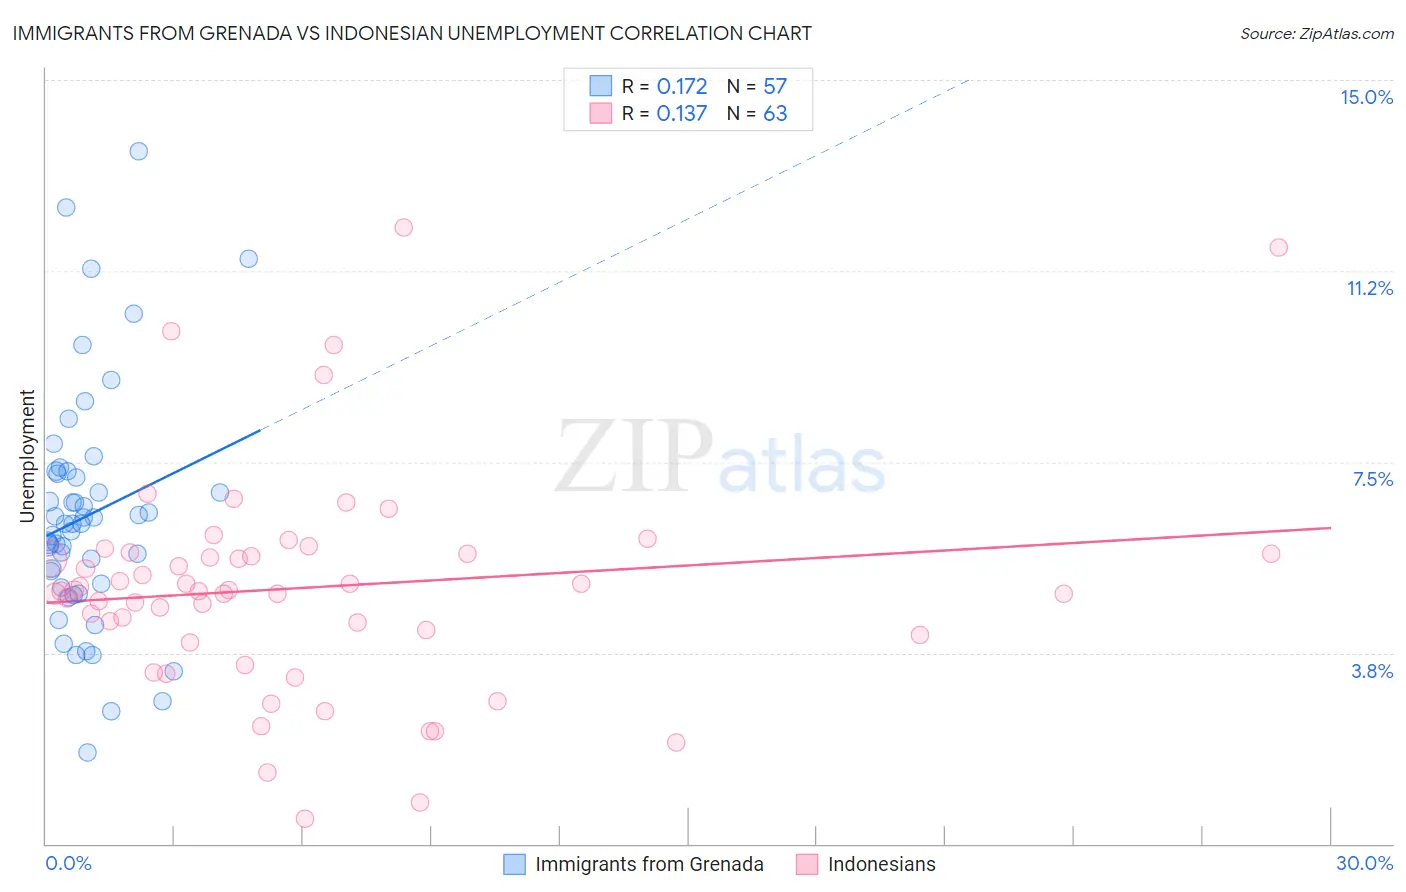
Immigrants from Grenada vs Indonesian Unemployment Correlation Chart
The statistical analysis conducted on geographies consisting of 67,187,292 people shows a poor positive correlation between the proportion of Immigrants from Grenada and unemployment in the United States with a correlation coefficient (R) of 0.172 and weighted average of 6.9%. Similarly, the statistical analysis conducted on geographies consisting of 162,697,031 people shows a poor positive correlation between the proportion of Indonesians and unemployment in the United States with a correlation coefficient (R) of 0.137 and weighted average of 5.1%, a difference of 34.7%.
Unemployment Correlation Summary
| Measurement | Immigrants from Grenada | Indonesian |
| Minimum | 1.8% | 0.50% |
| Maximum | 13.6% | 12.1% |
| Range | 11.8% | 11.6% |
| Mean | 6.4% | 5.0% |
| Median | 6.3% | 5.0% |
| Interquartile 25% (IQ1) | 5.1% | 4.1% |
| Interquartile 75% (IQ3) | 7.3% | 5.7% |
| Interquartile Range (IQR) | 2.2% | 1.6% |
| Standard Deviation (Sample) | 2.3% | 2.2% |
| Standard Deviation (Population) | 2.3% | 2.2% |
Similar Demographics by Unemployment
Demographics Similar to Immigrants from Grenada by Unemployment
In terms of unemployment, the demographic groups most similar to Immigrants from Grenada are Guyanese (6.9%, a difference of 0.32%), Immigrants from Guyana (6.9%, a difference of 0.36%), Immigrants from St. Vincent and the Grenadines (6.9%, a difference of 0.37%), Immigrants from Armenia (7.0%, a difference of 1.2%), and British West Indian (6.8%, a difference of 1.2%).
| Demographics | Rating | Rank | Unemployment |
| Immigrants | Dominica | 0.0 /100 | #316 | Tragic 6.7% |
| Shoshone | 0.0 /100 | #317 | Tragic 6.8% |
| Immigrants | Cabo Verde | 0.0 /100 | #318 | Tragic 6.8% |
| British West Indians | 0.0 /100 | #319 | Tragic 6.8% |
| Immigrants | St. Vincent and the Grenadines | 0.0 /100 | #320 | Tragic 6.9% |
| Immigrants | Guyana | 0.0 /100 | #321 | Tragic 6.9% |
| Guyanese | 0.0 /100 | #322 | Tragic 6.9% |
| Immigrants | Grenada | 0.0 /100 | #323 | Tragic 6.9% |
| Immigrants | Armenia | 0.0 /100 | #324 | Tragic 7.0% |
| Natives/Alaskans | 0.0 /100 | #325 | Tragic 7.0% |
| Paiute | 0.0 /100 | #326 | Tragic 7.1% |
| Pueblo | 0.0 /100 | #327 | Tragic 7.2% |
| Tsimshian | 0.0 /100 | #328 | Tragic 7.2% |
| Alaska Natives | 0.0 /100 | #329 | Tragic 7.2% |
| Yakama | 0.0 /100 | #330 | Tragic 7.3% |
Demographics Similar to Indonesians by Unemployment
In terms of unemployment, the demographic groups most similar to Indonesians are Immigrants from Chile (5.1%, a difference of 0.050%), Immigrants from Norway (5.1%, a difference of 0.050%), Immigrants from Asia (5.1%, a difference of 0.060%), Indian (Asian) (5.1%, a difference of 0.070%), and Immigrants from Pakistan (5.1%, a difference of 0.10%).
| Demographics | Rating | Rank | Unemployment |
| Immigrants | Saudi Arabia | 85.6 /100 | #137 | Excellent 5.1% |
| Immigrants | Hungary | 85.6 /100 | #138 | Excellent 5.1% |
| Pakistanis | 85.3 /100 | #139 | Excellent 5.1% |
| Immigrants | Denmark | 84.3 /100 | #140 | Excellent 5.1% |
| Palestinians | 83.4 /100 | #141 | Excellent 5.1% |
| Immigrants | Pakistan | 83.2 /100 | #142 | Excellent 5.1% |
| Immigrants | Chile | 82.8 /100 | #143 | Excellent 5.1% |
| Indonesians | 82.3 /100 | #144 | Excellent 5.1% |
| Immigrants | Norway | 81.8 /100 | #145 | Excellent 5.1% |
| Immigrants | Asia | 81.8 /100 | #146 | Excellent 5.1% |
| Indians (Asian) | 81.6 /100 | #147 | Excellent 5.1% |
| Immigrants | Italy | 79.1 /100 | #148 | Good 5.1% |
| Syrians | 77.7 /100 | #149 | Good 5.2% |
| Potawatomi | 76.2 /100 | #150 | Good 5.2% |
| Immigrants | Eastern Europe | 75.3 /100 | #151 | Good 5.2% |