Immigrants from Grenada vs Immigrants from Sierra Leone Unemployment Among Ages 35 to 44 years

COMPARE

Immigrants from Grenada
Race
Ancestry
AfghanAfricanAlaska NativeAlaskan AthabascanAlbanianAleutAlsatianAmericanApacheArabArapahoArgentineanArmenianAssyrian/Chaldean/SyriacAustralianAustrianBahamianBangladeshiBarbadianBasqueBelgianBelizeanBermudanBhutaneseBlackfeetBolivianBrazilianBritishBritish West IndianBulgarianBurmeseCajunCambodianCanadianCape VerdeanCarpatho RusynCelticCentral AmericanCentral American IndianCherokeeCheyenneChickasawChileanChineseChippewaChoctawColombianColvilleComancheCosta RicanCreeCreekCroatianCrowCubanCypriotCzechCzechoslovakianDanishDelawareDominicanDutchDutch West IndianEastern EuropeanEcuadorianEgyptianEnglishEstonianEthiopianEuropeanFijianFilipinoFinnishFrenchFrench American IndianFrench CanadianGermanGerman RussianGhanaianGreekGuamanian/ChamorroGuatemalanGuyaneseHaitianHmongHonduranHopiHoumaHungarianIcelanderIndian (Asian)IndonesianInupiatIranianIraqiIrishIroquoisIsraeliItalianJamaicanJapaneseJordanianKenyanKiowaKoreanLaotianLatvianLebaneseLiberianLithuanianLumbeeLuxembourgerMacedonianMalaysianMalteseMarshalleseMenomineeMexicanMexican American IndianMongolianMoroccanNative HawaiianNavajoNepaleseNew ZealanderNicaraguanNigerianNorthern EuropeanNorwegianOkinawanOsageOttawaPaiutePakistaniPalestinianPanamanianParaguayanPennsylvania GermanPeruvianPimaPolishPortuguesePotawatomiPuebloPuerto RicanPuget Sound SalishRomanianRussianSalvadoranSamoanScandinavianScotch-IrishScottishSeminoleSenegaleseSerbianShoshoneSierra LeoneanSiouxSlavicSlovakSloveneSomaliSouth AfricanSouth AmericanSouth American IndianSoviet UnionSpaniardSpanishSpanish AmericanSpanish American IndianSri LankanSubsaharan AfricanSudaneseSwedishSwissSyrianTaiwaneseThaiTlingit-HaidaTohono O'OdhamTonganTrinidadian and TobagonianTsimshianTurkishU.S. Virgin IslanderUgandanUkrainianUruguayanUteVenezuelanVietnameseWelshWest IndianYakamaYaquiYugoslavianYumanYup'ikZimbabwean
Immigration
NonimmigrantsImmigrantsAfghanistanAfricaAlbaniaArgentinaArmeniaAsiaAustraliaAustriaBahamasBangladeshBarbadosBelarusBelgiumBelizeBoliviaBosnia and HerzegovinaBrazilBulgariaBurma/MyanmarCabo VerdeCambodiaCameroonCanadaCaribbeanCentral AmericaChileChinaColombiaCongoCosta RicaCroatiaCubaCzechoslovakiaDenmarkDominicaDominican RepublicEastern AfricaEastern AsiaEastern EuropeEcuadorEgyptEl SalvadorEnglandEritreaEthiopiaEuropeFijiFranceGermanyGhanaGreeceGrenadaGuatemalaGuyanaHaitiHondurasHong KongHungaryIndiaIndonesiaIranIraqIrelandIsraelItalyJamaicaJapanJordanKazakhstanKenyaKoreaKuwaitLaosLatin AmericaLatviaLebanonLiberiaLithuaniaMalaysiaMexicoMicronesiaMiddle AfricaMoldovaMoroccoNepalNetherlandsNicaraguaNigeriaNorth AmericaNorth MacedoniaNorthern AfricaNorthern EuropeNorwayOceaniaPakistanPanamaPeruPhilippinesPolandPortugalRomaniaRussiaSaudi ArabiaScotlandSenegalSerbiaSingaporeSomaliaSouth AfricaSouth AmericaSouth Central AsiaSouth Eastern AsiaSouthern EuropeSpainSri LankaSt. Vincent and the GrenadinesSudanSwedenSwitzerlandSyriaTaiwanThailandTrinidad and TobagoTurkeyUgandaUkraineUruguayUzbekistanVenezuelaVietnamWest IndiesWestern AfricaWestern AsiaWestern EuropeYemenZaireZimbabweAzores
Immigrants from Sierra Leone
Race
Ancestry
AfghanAfricanAlaska NativeAlaskan AthabascanAlbanianAleutAlsatianAmericanApacheArabArapahoArgentineanArmenianAssyrian/Chaldean/SyriacAustralianAustrianBahamianBangladeshiBarbadianBasqueBelgianBelizeanBermudanBhutaneseBlackfeetBolivianBrazilianBritishBritish West IndianBulgarianBurmeseCajunCambodianCanadianCape VerdeanCarpatho RusynCelticCentral AmericanCentral American IndianCherokeeCheyenneChickasawChileanChineseChippewaChoctawColombianColvilleComancheCosta RicanCreeCreekCroatianCrowCubanCypriotCzechCzechoslovakianDanishDelawareDominicanDutchDutch West IndianEastern EuropeanEcuadorianEgyptianEnglishEstonianEthiopianEuropeanFijianFilipinoFinnishFrenchFrench American IndianFrench CanadianGermanGerman RussianGhanaianGreekGuamanian/ChamorroGuatemalanGuyaneseHaitianHmongHonduranHopiHoumaHungarianIcelanderIndian (Asian)IndonesianInupiatIranianIraqiIrishIroquoisIsraeliItalianJamaicanJapaneseJordanianKenyanKiowaKoreanLaotianLatvianLebaneseLiberianLithuanianLumbeeLuxembourgerMacedonianMalaysianMalteseMarshalleseMenomineeMexicanMexican American IndianMongolianMoroccanNative HawaiianNavajoNepaleseNew ZealanderNicaraguanNigerianNorthern EuropeanNorwegianOkinawanOsageOttawaPaiutePakistaniPalestinianPanamanianParaguayanPennsylvania GermanPeruvianPimaPolishPortuguesePotawatomiPuebloPuerto RicanPuget Sound SalishRomanianRussianSalvadoranSamoanScandinavianScotch-IrishScottishSeminoleSenegaleseSerbianShoshoneSierra LeoneanSiouxSlavicSlovakSloveneSomaliSouth AfricanSouth AmericanSouth American IndianSoviet UnionSpaniardSpanishSpanish AmericanSpanish American IndianSri LankanSubsaharan AfricanSudaneseSwedishSwissSyrianTaiwaneseThaiTlingit-HaidaTohono O'OdhamTonganTrinidadian and TobagonianTsimshianTurkishU.S. Virgin IslanderUgandanUkrainianUruguayanUteVenezuelanVietnameseWelshWest IndianYakamaYaquiYugoslavianYumanYup'ikZimbabwean
Immigration
NonimmigrantsImmigrantsAfghanistanAfricaAlbaniaArgentinaArmeniaAsiaAustraliaAustriaBahamasBangladeshBarbadosBelarusBelgiumBelizeBoliviaBosnia and HerzegovinaBrazilBulgariaBurma/MyanmarCabo VerdeCambodiaCameroonCanadaCaribbeanCentral AmericaChileChinaColombiaCongoCosta RicaCroatiaCubaCzechoslovakiaDenmarkDominicaDominican RepublicEastern AfricaEastern AsiaEastern EuropeEcuadorEgyptEl SalvadorEnglandEritreaEthiopiaEuropeFijiFranceGermanyGhanaGreeceGuatemalaGuyanaHaitiHondurasHong KongHungaryIndiaIndonesiaIranIraqIrelandIsraelItalyJamaicaJapanJordanKazakhstanKenyaKoreaKuwaitLaosLatin AmericaLatviaLebanonLiberiaLithuaniaMalaysiaMexicoMicronesiaMiddle AfricaMoldovaMoroccoNepalNetherlandsNicaraguaNigeriaNorth AmericaNorth MacedoniaNorthern AfricaNorthern EuropeNorwayOceaniaPakistanPanamaPeruPhilippinesPolandPortugalRomaniaRussiaSaudi ArabiaScotlandSenegalSerbiaSierra LeoneSingaporeSomaliaSouth AfricaSouth AmericaSouth Central AsiaSouth Eastern AsiaSouthern EuropeSpainSri LankaSt. Vincent and the GrenadinesSudanSwedenSwitzerlandSyriaTaiwanThailandTrinidad and TobagoTurkeyUgandaUkraineUruguayUzbekistanVenezuelaVietnamWest IndiesWestern AfricaWestern AsiaWestern EuropeYemenZaireZimbabweAzores
Unemployment Among Ages 35 to 44 years
Income
Poverty
Unemployment
Labor Participation
Family Structure
Vehicle Availability
Education Level
Disability

Unemployment Among Ages 35 to 44 years Comparison

Immigrants from Grenada

Immigrants from Sierra Leone

Tragic
Tragic
6.2%
UNEMPLOYMENT AMONG AGES 35 TO 44 YEARS
0.0/ 100
METRIC RATING
319th/ 347
METRIC RANK
4.9%
UNEMPLOYMENT AMONG AGES 35 TO 44 YEARS
4.7/ 100
METRIC RATING
220th/ 347
METRIC RANK

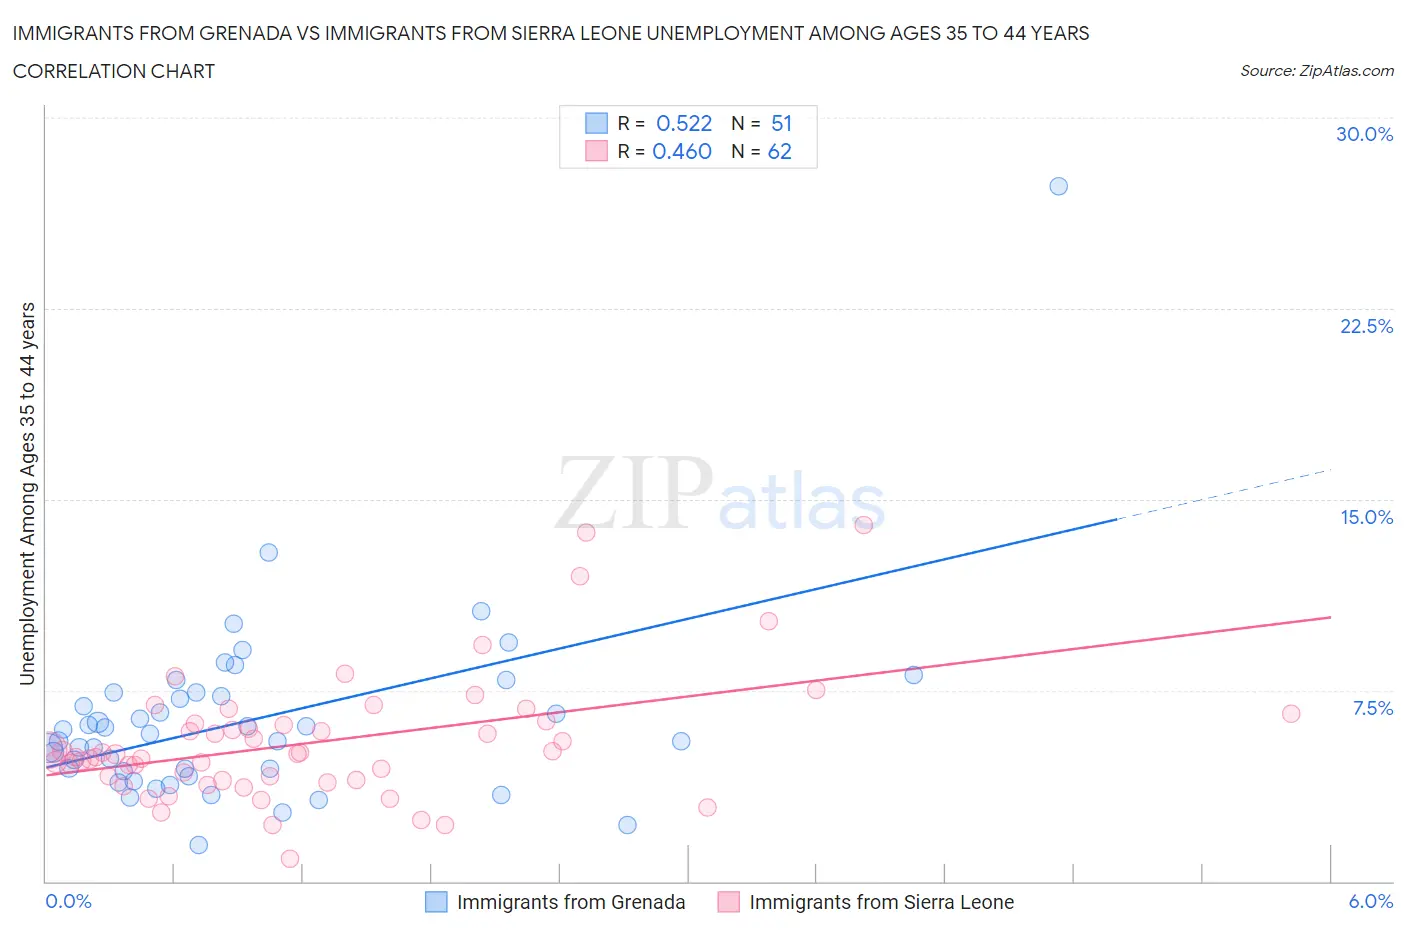
Immigrants from Grenada vs Immigrants from Sierra Leone Unemployment Among Ages 35 to 44 years Correlation Chart

The statistical analysis conducted on geographies consisting of 66,976,406 people shows a substantial positive correlation between the proportion of Immigrants from Grenada and unemployment rate among population between the ages 35 and 44 in the United States with a correlation coefficient (R) of 0.522 and weighted average of 6.2%. Similarly, the statistical analysis conducted on geographies consisting of 101,194,728 people shows a moderate positive correlation between the proportion of Immigrants from Sierra Leone and unemployment rate among population between the ages 35 and 44 in the United States with a correlation coefficient (R) of 0.460 and weighted average of 4.9%, a difference of 25.7%.
Immigrants from Grenada vs Immigrants from Sierra Leone Unemployment Among Ages 35 to 44 years

Unemployment Among Ages 35 to 44 years Correlation Summary

MeasurementImmigrants from GrenadaImmigrants from Sierra Leone
Minimum1.4%0.90%
Maximum27.3%14.0%
Range25.9%13.1%
Mean6.3%5.5%
Median5.8%5.0%
Interquartile 25% (IQ1)4.3%4.0%
Interquartile 75% (IQ3)7.4%6.2%
Interquartile Range (IQR)3.1%2.2%
Standard Deviation (Sample)3.8%2.5%
Standard Deviation (Population)3.7%2.4%

Similar Demographics by Unemployment Among Ages 35 to 44 years

Demographics Similar to Immigrants from Grenada by Unemployment Among Ages 35 to 44 years

In terms of unemployment among ages 35 to 44 years, the demographic groups most similar to Immigrants from Grenada are Immigrants from Armenia (6.2%, a difference of 0.24%), Colville (6.2%, a difference of 0.25%), Chippewa (6.2%, a difference of 0.30%), Immigrants from St. Vincent and the Grenadines (6.2%, a difference of 0.67%), and Tsimshian (6.2%, a difference of 0.86%).
DemographicsRating | RankUnemployment Among Ages 35 to 44 years
Immigrants | Guyana
0.0
/100
|
#312
Tragic
6.0%
British West Indians
0.0
/100
|
#313
Tragic
6.0%
Immigrants | Dominica
0.0
/100
|
#314
Tragic
6.0%
Blacks/African Americans
0.0
/100
|
#315
Tragic
6.1%
Tsimshian
0.0
/100
|
#316
Tragic
6.2%
Immigrants | St. Vincent and the Grenadines
0.0
/100
|
#317
Tragic
6.2%
Colville
0.0
/100
|
#318
Tragic
6.2%
Immigrants | Grenada
0.0
/100
|
#319
Tragic
6.2%
Immigrants | Armenia
0.0
/100
|
#320
Tragic
6.2%
Chippewa
0.0
/100
|
#321
Tragic
6.2%
Immigrants | Dominican Republic
0.0
/100
|
#322
Tragic
6.4%
Dominicans
0.0
/100
|
#323
Tragic
6.4%
Menominee
0.0
/100
|
#324
Tragic
6.5%
Immigrants | Yemen
0.0
/100
|
#325
Tragic
6.6%
Alaska Natives
0.0
/100
|
#326
Tragic
6.6%

Demographics Similar to Immigrants from Sierra Leone by Unemployment Among Ages 35 to 44 years

In terms of unemployment among ages 35 to 44 years, the demographic groups most similar to Immigrants from Sierra Leone are Sierra Leonean (4.9%, a difference of 0.030%), Bermudan (5.0%, a difference of 0.32%), Chickasaw (4.9%, a difference of 0.34%), Moroccan (4.9%, a difference of 0.45%), and American (4.9%, a difference of 0.49%).
DemographicsRating | RankUnemployment Among Ages 35 to 44 years
Osage
8.6
/100
|
#213
Tragic
4.9%
Immigrants | Africa
8.2
/100
|
#214
Tragic
4.9%
Immigrants | Immigrants
8.0
/100
|
#215
Tragic
4.9%
Americans
6.2
/100
|
#216
Tragic
4.9%
Moroccans
6.0
/100
|
#217
Tragic
4.9%
Chickasaw
5.7
/100
|
#218
Tragic
4.9%
Sierra Leoneans
4.8
/100
|
#219
Tragic
4.9%
Immigrants | Sierra Leone
4.7
/100
|
#220
Tragic
4.9%
Bermudans
3.9
/100
|
#221
Tragic
5.0%
Hmong
3.5
/100
|
#222
Tragic
5.0%
Immigrants | Panama
3.3
/100
|
#223
Tragic
5.0%
Panamanians
2.9
/100
|
#224
Tragic
5.0%
Immigrants | Lebanon
2.7
/100
|
#225
Tragic
5.0%
Potawatomi
2.5
/100
|
#226
Tragic
5.0%
Immigrants | Uzbekistan
1.9
/100
|
#227
Tragic
5.0%