Immigrants from Greece vs Palestinian Unemployment Among Ages 25 to 29 years
COMPARE
Immigrants from Greece
Palestinian
Unemployment Among Ages 25 to 29 years
Unemployment Among Ages 25 to 29 years Comparison
Immigrants from Greece
Palestinians
6.7%
UNEMPLOYMENT AMONG AGES 25 TO 29 YEARS
28.0/ 100
METRIC RATING
194th/ 347
METRIC RANK
6.3%
UNEMPLOYMENT AMONG AGES 25 TO 29 YEARS
97.7/ 100
METRIC RATING
68th/ 347
METRIC RANK
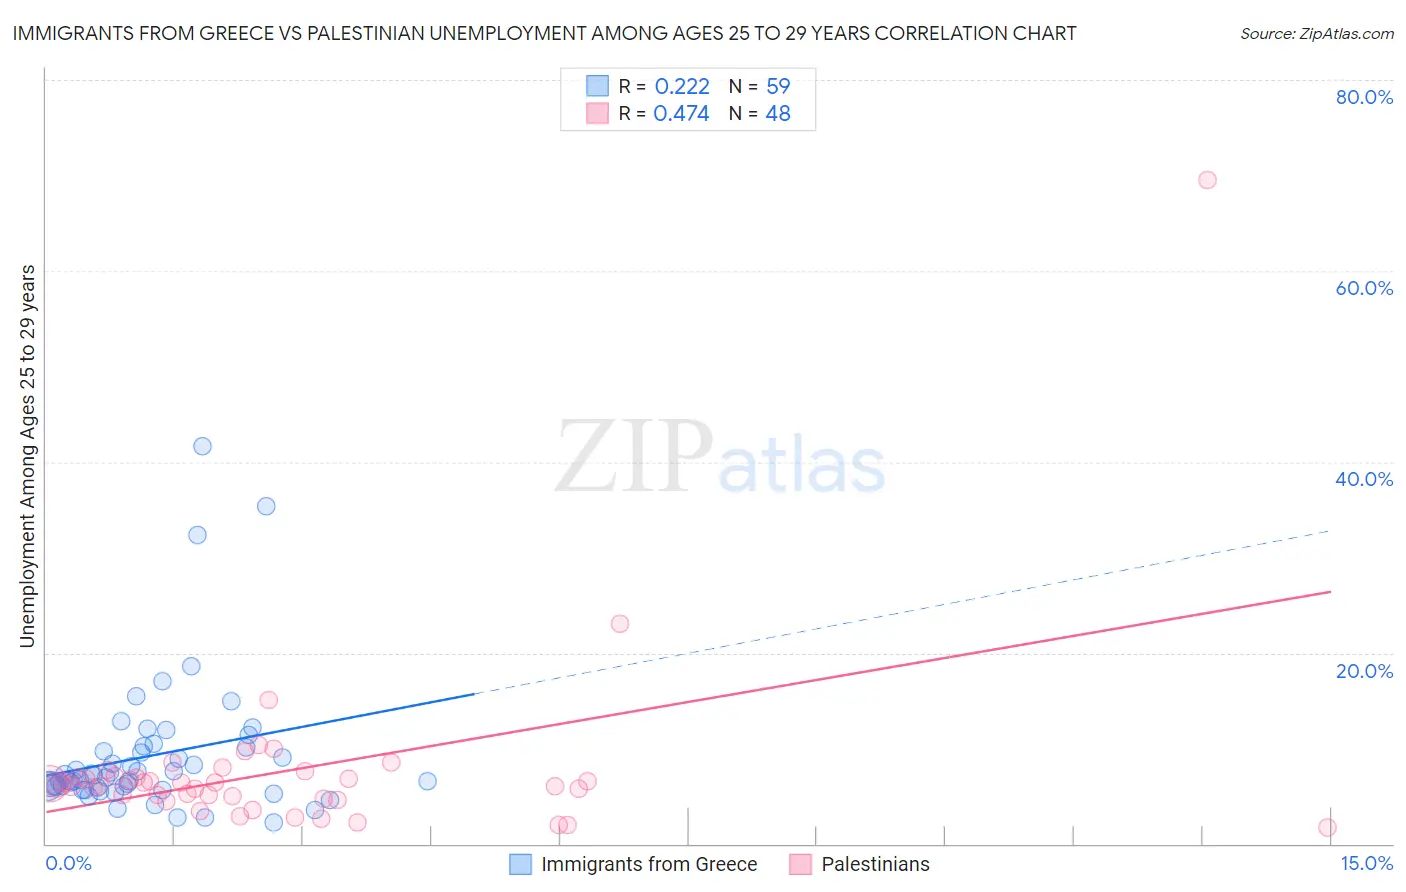
Immigrants from Greece vs Palestinian Unemployment Among Ages 25 to 29 years Correlation Chart
The statistical analysis conducted on geographies consisting of 210,073,502 people shows a weak positive correlation between the proportion of Immigrants from Greece and unemployment rate among population between the ages 25 and 29 in the United States with a correlation coefficient (R) of 0.222 and weighted average of 6.7%. Similarly, the statistical analysis conducted on geographies consisting of 211,975,975 people shows a moderate positive correlation between the proportion of Palestinians and unemployment rate among population between the ages 25 and 29 in the United States with a correlation coefficient (R) of 0.474 and weighted average of 6.3%, a difference of 7.7%.
Unemployment Among Ages 25 to 29 years Correlation Summary
| Measurement | Immigrants from Greece | Palestinian |
| Minimum | 2.2% | 1.7% |
| Maximum | 41.7% | 69.5% |
| Range | 39.5% | 67.8% |
| Mean | 9.2% | 7.7% |
| Median | 6.9% | 6.2% |
| Interquartile 25% (IQ1) | 5.9% | 4.9% |
| Interquartile 75% (IQ3) | 10.1% | 7.0% |
| Interquartile Range (IQR) | 4.2% | 2.2% |
| Standard Deviation (Sample) | 7.2% | 9.7% |
| Standard Deviation (Population) | 7.2% | 9.6% |
Similar Demographics by Unemployment Among Ages 25 to 29 years
Demographics Similar to Immigrants from Greece by Unemployment Among Ages 25 to 29 years
In terms of unemployment among ages 25 to 29 years, the demographic groups most similar to Immigrants from Greece are Alsatian (6.7%, a difference of 0.0%), Immigrants from Ukraine (6.7%, a difference of 0.040%), Chickasaw (6.7%, a difference of 0.050%), Immigrants from Western Asia (6.7%, a difference of 0.060%), and Korean (6.7%, a difference of 0.090%).
| Demographics | Rating | Rank | Unemployment Among Ages 25 to 29 years |
| Immigrants | South America | 33.0 /100 | #187 | Fair 6.7% |
| Irish | 32.8 /100 | #188 | Fair 6.7% |
| Argentineans | 32.1 /100 | #189 | Fair 6.7% |
| Koreans | 29.3 /100 | #190 | Fair 6.7% |
| Chickasaw | 28.7 /100 | #191 | Fair 6.7% |
| Immigrants | Ukraine | 28.6 /100 | #192 | Fair 6.7% |
| Alsatians | 28.1 /100 | #193 | Fair 6.7% |
| Immigrants | Greece | 28.0 /100 | #194 | Fair 6.7% |
| Immigrants | Western Asia | 27.3 /100 | #195 | Fair 6.7% |
| Hungarians | 26.8 /100 | #196 | Fair 6.8% |
| Italians | 26.5 /100 | #197 | Fair 6.8% |
| Immigrants | Southern Europe | 24.6 /100 | #198 | Fair 6.8% |
| Guamanians/Chamorros | 24.3 /100 | #199 | Fair 6.8% |
| South American Indians | 23.3 /100 | #200 | Fair 6.8% |
| Basques | 22.5 /100 | #201 | Fair 6.8% |
Demographics Similar to Palestinians by Unemployment Among Ages 25 to 29 years
In terms of unemployment among ages 25 to 29 years, the demographic groups most similar to Palestinians are Indian (Asian) (6.3%, a difference of 0.050%), Immigrants from Northern Africa (6.3%, a difference of 0.050%), Immigrants from Lebanon (6.3%, a difference of 0.070%), Immigrants from Sri Lanka (6.3%, a difference of 0.13%), and Kenyan (6.3%, a difference of 0.18%).
| Demographics | Rating | Rank | Unemployment Among Ages 25 to 29 years |
| Bhutanese | 98.2 /100 | #61 | Exceptional 6.2% |
| Immigrants | China | 98.1 /100 | #62 | Exceptional 6.2% |
| Kenyans | 98.0 /100 | #63 | Exceptional 6.3% |
| Immigrants | Sri Lanka | 97.9 /100 | #64 | Exceptional 6.3% |
| Immigrants | Lebanon | 97.8 /100 | #65 | Exceptional 6.3% |
| Indians (Asian) | 97.8 /100 | #66 | Exceptional 6.3% |
| Immigrants | Northern Africa | 97.8 /100 | #67 | Exceptional 6.3% |
| Palestinians | 97.7 /100 | #68 | Exceptional 6.3% |
| Immigrants | Hong Kong | 97.5 /100 | #69 | Exceptional 6.3% |
| Immigrants | Malaysia | 97.5 /100 | #70 | Exceptional 6.3% |
| Immigrants | France | 97.4 /100 | #71 | Exceptional 6.3% |
| Scandinavians | 97.4 /100 | #72 | Exceptional 6.3% |
| Belgians | 97.0 /100 | #73 | Exceptional 6.3% |
| Carpatho Rusyns | 96.9 /100 | #74 | Exceptional 6.3% |
| Immigrants | Jordan | 96.8 /100 | #75 | Exceptional 6.3% |