Immigrants from Ghana vs Immigrants from Trinidad and Tobago Unemployment Among Youth under 25 years
COMPARE
Immigrants from Ghana
Immigrants from Trinidad and Tobago
Unemployment Among Youth under 25 years
Unemployment Among Youth under 25 years Comparison
Immigrants from Ghana
Immigrants from Trinidad and Tobago
13.4%
UNEMPLOYMENT AMONG YOUTH UNDER 25 YEARS
0.0/ 100
METRIC RATING
289th/ 347
METRIC RANK
14.6%
UNEMPLOYMENT AMONG YOUTH UNDER 25 YEARS
0.0/ 100
METRIC RATING
323rd/ 347
METRIC RANK
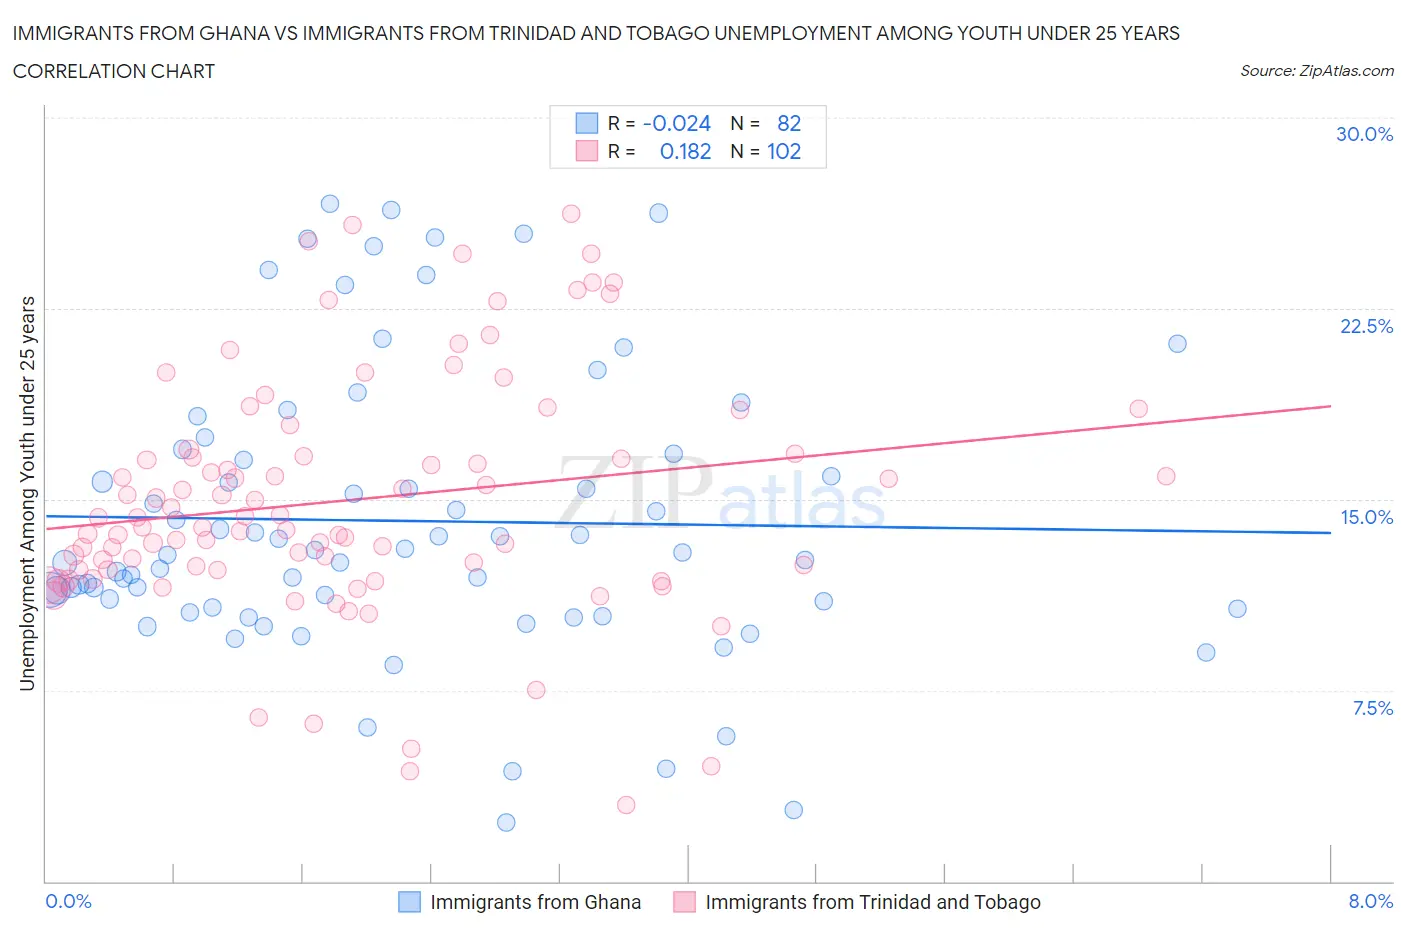
Immigrants from Ghana vs Immigrants from Trinidad and Tobago Unemployment Among Youth under 25 years Correlation Chart
The statistical analysis conducted on geographies consisting of 199,301,284 people shows no correlation between the proportion of Immigrants from Ghana and unemployment rate among youth under the age of 25 in the United States with a correlation coefficient (R) of -0.024 and weighted average of 13.4%. Similarly, the statistical analysis conducted on geographies consisting of 222,365,515 people shows a poor positive correlation between the proportion of Immigrants from Trinidad and Tobago and unemployment rate among youth under the age of 25 in the United States with a correlation coefficient (R) of 0.182 and weighted average of 14.6%, a difference of 9.4%.
Unemployment Among Youth under 25 years Correlation Summary
| Measurement | Immigrants from Ghana | Immigrants from Trinidad and Tobago |
| Minimum | 2.3% | 3.0% |
| Maximum | 26.6% | 26.2% |
| Range | 24.3% | 23.2% |
| Mean | 14.2% | 15.0% |
| Median | 12.9% | 14.1% |
| Interquartile 25% (IQ1) | 10.7% | 12.2% |
| Interquartile 75% (IQ3) | 16.8% | 16.8% |
| Interquartile Range (IQR) | 6.1% | 4.6% |
| Standard Deviation (Sample) | 5.6% | 4.7% |
| Standard Deviation (Population) | 5.5% | 4.7% |
Similar Demographics by Unemployment Among Youth under 25 years
Demographics Similar to Immigrants from Ghana by Unemployment Among Youth under 25 years
In terms of unemployment among youth under 25 years, the demographic groups most similar to Immigrants from Ghana are Immigrants from Western Africa (13.4%, a difference of 0.11%), Immigrants from Ecuador (13.4%, a difference of 0.34%), Ecuadorian (13.3%, a difference of 0.54%), Blackfeet (13.3%, a difference of 0.55%), and Ghanaian (13.3%, a difference of 0.60%).
| Demographics | Rating | Rank | Unemployment Among Youth under 25 years |
| Sierra Leoneans | 0.0 /100 | #282 | Tragic 13.3% |
| Immigrants | Cameroon | 0.0 /100 | #283 | Tragic 13.3% |
| Lumbee | 0.0 /100 | #284 | Tragic 13.3% |
| Ghanaians | 0.0 /100 | #285 | Tragic 13.3% |
| Blackfeet | 0.0 /100 | #286 | Tragic 13.3% |
| Ecuadorians | 0.0 /100 | #287 | Tragic 13.3% |
| Immigrants | Western Africa | 0.0 /100 | #288 | Tragic 13.4% |
| Immigrants | Ghana | 0.0 /100 | #289 | Tragic 13.4% |
| Immigrants | Ecuador | 0.0 /100 | #290 | Tragic 13.4% |
| Apache | 0.0 /100 | #291 | Tragic 13.5% |
| Central American Indians | 0.0 /100 | #292 | Tragic 13.5% |
| Spanish American Indians | 0.0 /100 | #293 | Tragic 13.5% |
| Immigrants | Caribbean | 0.0 /100 | #294 | Tragic 13.5% |
| Chippewa | 0.0 /100 | #295 | Tragic 13.5% |
| Senegalese | 0.0 /100 | #296 | Tragic 13.5% |
Demographics Similar to Immigrants from Trinidad and Tobago by Unemployment Among Youth under 25 years
In terms of unemployment among youth under 25 years, the demographic groups most similar to Immigrants from Trinidad and Tobago are Trinidadian and Tobagonian (14.6%, a difference of 0.090%), Cheyenne (14.6%, a difference of 0.16%), Barbadian (14.6%, a difference of 0.32%), West Indian (14.6%, a difference of 0.36%), and Immigrants from Dominica (14.6%, a difference of 0.40%).
| Demographics | Rating | Rank | Unemployment Among Youth under 25 years |
| Natives/Alaskans | 0.0 /100 | #316 | Tragic 14.5% |
| Blacks/African Americans | 0.0 /100 | #317 | Tragic 14.5% |
| Immigrants | Dominica | 0.0 /100 | #318 | Tragic 14.6% |
| West Indians | 0.0 /100 | #319 | Tragic 14.6% |
| Barbadians | 0.0 /100 | #320 | Tragic 14.6% |
| Cheyenne | 0.0 /100 | #321 | Tragic 14.6% |
| Trinidadians and Tobagonians | 0.0 /100 | #322 | Tragic 14.6% |
| Immigrants | Trinidad and Tobago | 0.0 /100 | #323 | Tragic 14.6% |
| Immigrants | Jamaica | 0.0 /100 | #324 | Tragic 14.8% |
| Alaska Natives | 0.0 /100 | #325 | Tragic 14.9% |
| Immigrants | Barbados | 0.0 /100 | #326 | Tragic 15.2% |
| British West Indians | 0.0 /100 | #327 | Tragic 15.5% |
| Immigrants | Dominican Republic | 0.0 /100 | #328 | Tragic 15.6% |
| Immigrants | Yemen | 0.0 /100 | #329 | Tragic 15.6% |
| Yakama | 0.0 /100 | #330 | Tragic 15.6% |