Immigrants from Ghana vs Immigrants from Singapore Unemployment Among Women with Children Ages 6 to 17 years
COMPARE
Immigrants from Ghana
Immigrants from Singapore
Unemployment Among Women with Children Ages 6 to 17 years
Unemployment Among Women with Children Ages 6 to 17 years Comparison
Immigrants from Ghana
Immigrants from Singapore
9.5%
UNEMPLOYMENT AMONG WOMEN WITH CHILDREN AGES 6 TO 17 YEARS
0.4/ 100
METRIC RATING
264th/ 347
METRIC RANK
7.7%
UNEMPLOYMENT AMONG WOMEN WITH CHILDREN AGES 6 TO 17 YEARS
100.0/ 100
METRIC RATING
20th/ 347
METRIC RANK
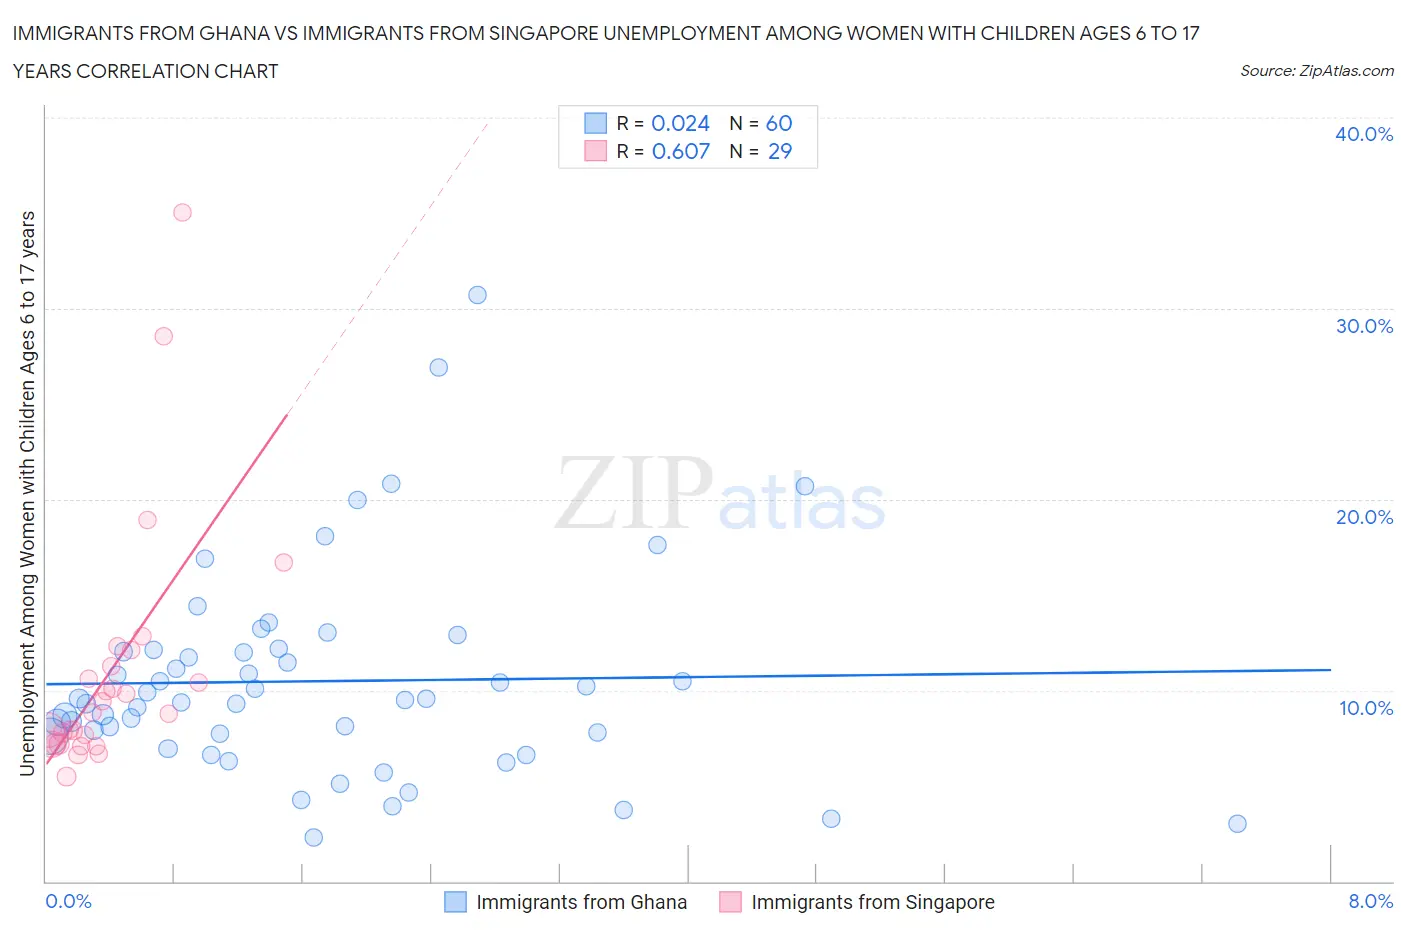
Immigrants from Ghana vs Immigrants from Singapore Unemployment Among Women with Children Ages 6 to 17 years Correlation Chart
The statistical analysis conducted on geographies consisting of 165,936,038 people shows no correlation between the proportion of Immigrants from Ghana and unemployment rate among women with children between the ages 6 and 17 in the United States with a correlation coefficient (R) of 0.024 and weighted average of 9.5%. Similarly, the statistical analysis conducted on geographies consisting of 115,099,593 people shows a significant positive correlation between the proportion of Immigrants from Singapore and unemployment rate among women with children between the ages 6 and 17 in the United States with a correlation coefficient (R) of 0.607 and weighted average of 7.7%, a difference of 24.4%.
Unemployment Among Women with Children Ages 6 to 17 years Correlation Summary
| Measurement | Immigrants from Ghana | Immigrants from Singapore |
| Minimum | 2.3% | 5.5% |
| Maximum | 30.7% | 35.0% |
| Range | 28.4% | 29.5% |
| Mean | 10.5% | 11.0% |
| Median | 9.5% | 8.9% |
| Interquartile 25% (IQ1) | 7.7% | 7.2% |
| Interquartile 75% (IQ3) | 12.1% | 11.7% |
| Interquartile Range (IQR) | 4.4% | 4.5% |
| Standard Deviation (Sample) | 5.4% | 6.5% |
| Standard Deviation (Population) | 5.4% | 6.4% |
Similar Demographics by Unemployment Among Women with Children Ages 6 to 17 years
Demographics Similar to Immigrants from Ghana by Unemployment Among Women with Children Ages 6 to 17 years
In terms of unemployment among women with children ages 6 to 17 years, the demographic groups most similar to Immigrants from Ghana are West Indian (9.5%, a difference of 0.030%), Immigrants from Jamaica (9.5%, a difference of 0.20%), Irish (9.5%, a difference of 0.21%), Lebanese (9.5%, a difference of 0.24%), and Senegalese (9.5%, a difference of 0.28%).
| Demographics | Rating | Rank | Unemployment Among Women with Children Ages 6 to 17 years |
| Celtics | 0.7 /100 | #257 | Tragic 9.5% |
| Immigrants | Mexico | 0.7 /100 | #258 | Tragic 9.5% |
| Immigrants | Central America | 0.6 /100 | #259 | Tragic 9.5% |
| Italians | 0.6 /100 | #260 | Tragic 9.5% |
| South Americans | 0.5 /100 | #261 | Tragic 9.5% |
| Senegalese | 0.5 /100 | #262 | Tragic 9.5% |
| Lebanese | 0.5 /100 | #263 | Tragic 9.5% |
| Immigrants | Ghana | 0.4 /100 | #264 | Tragic 9.5% |
| West Indians | 0.4 /100 | #265 | Tragic 9.5% |
| Immigrants | Jamaica | 0.3 /100 | #266 | Tragic 9.5% |
| Irish | 0.3 /100 | #267 | Tragic 9.5% |
| Ghanaians | 0.2 /100 | #268 | Tragic 9.6% |
| Blackfeet | 0.2 /100 | #269 | Tragic 9.6% |
| Immigrants | Nicaragua | 0.2 /100 | #270 | Tragic 9.6% |
| Immigrants | Latin America | 0.1 /100 | #271 | Tragic 9.6% |
Demographics Similar to Immigrants from Singapore by Unemployment Among Women with Children Ages 6 to 17 years
In terms of unemployment among women with children ages 6 to 17 years, the demographic groups most similar to Immigrants from Singapore are Immigrants from India (7.7%, a difference of 0.13%), Immigrants from China (7.7%, a difference of 0.42%), Immigrants from Indonesia (7.7%, a difference of 0.81%), Nepalese (7.7%, a difference of 0.81%), and Immigrants from Eastern Asia (7.7%, a difference of 0.94%).
| Demographics | Rating | Rank | Unemployment Among Women with Children Ages 6 to 17 years |
| Indonesians | 100.0 /100 | #13 | Exceptional 7.4% |
| Sudanese | 100.0 /100 | #14 | Exceptional 7.4% |
| Puget Sound Salish | 100.0 /100 | #15 | Exceptional 7.5% |
| Immigrants | Burma/Myanmar | 100.0 /100 | #16 | Exceptional 7.5% |
| Cambodians | 100.0 /100 | #17 | Exceptional 7.5% |
| Afghans | 100.0 /100 | #18 | Exceptional 7.6% |
| Filipinos | 100.0 /100 | #19 | Exceptional 7.6% |
| Immigrants | Singapore | 100.0 /100 | #20 | Exceptional 7.7% |
| Immigrants | India | 100.0 /100 | #21 | Exceptional 7.7% |
| Immigrants | China | 100.0 /100 | #22 | Exceptional 7.7% |
| Immigrants | Indonesia | 100.0 /100 | #23 | Exceptional 7.7% |
| Nepalese | 100.0 /100 | #24 | Exceptional 7.7% |
| Immigrants | Eastern Asia | 100.0 /100 | #25 | Exceptional 7.7% |
| Indians (Asian) | 100.0 /100 | #26 | Exceptional 7.7% |
| Immigrants | Afghanistan | 100.0 /100 | #27 | Exceptional 7.8% |