Immigrants from Ghana vs Burmese Unemployment Among Ages 16 to 19 years
COMPARE
Immigrants from Ghana
Burmese
Unemployment Among Ages 16 to 19 years
Unemployment Among Ages 16 to 19 years Comparison
Immigrants from Ghana
Burmese
19.8%
UNEMPLOYMENT AMONG AGES 16 TO 19 YEARS
0.0/ 100
METRIC RATING
287th/ 347
METRIC RANK
17.0%
UNEMPLOYMENT AMONG AGES 16 TO 19 YEARS
95.0/ 100
METRIC RATING
98th/ 347
METRIC RANK
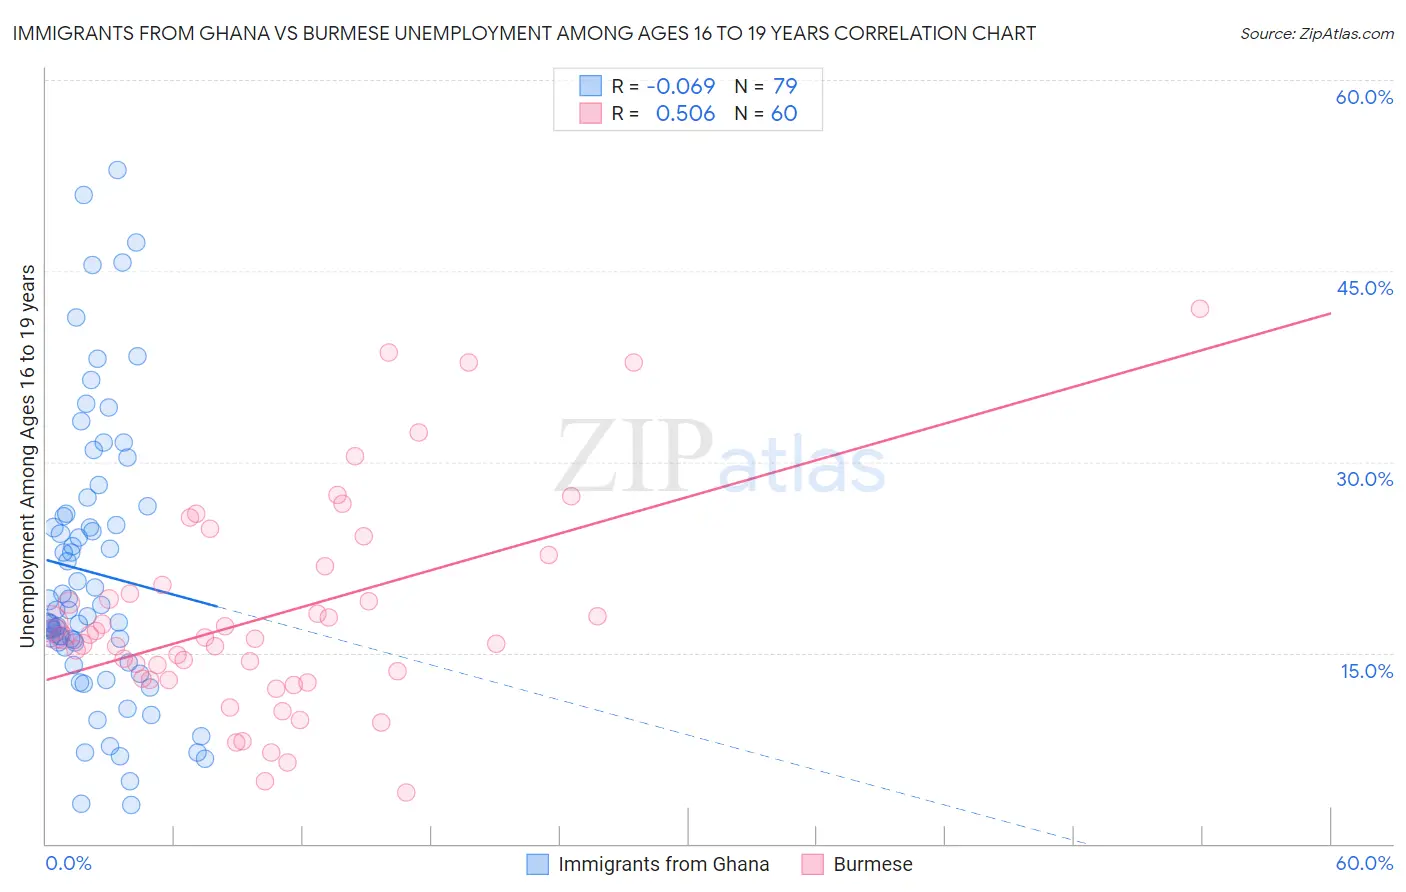
Immigrants from Ghana vs Burmese Unemployment Among Ages 16 to 19 years Correlation Chart
The statistical analysis conducted on geographies consisting of 195,838,231 people shows a slight negative correlation between the proportion of Immigrants from Ghana and unemployment rate among population between the ages 16 and 19 in the United States with a correlation coefficient (R) of -0.069 and weighted average of 19.8%. Similarly, the statistical analysis conducted on geographies consisting of 436,604,965 people shows a substantial positive correlation between the proportion of Burmese and unemployment rate among population between the ages 16 and 19 in the United States with a correlation coefficient (R) of 0.506 and weighted average of 17.0%, a difference of 16.7%.
Unemployment Among Ages 16 to 19 years Correlation Summary
| Measurement | Immigrants from Ghana | Burmese |
| Minimum | 3.0% | 4.0% |
| Maximum | 52.9% | 42.0% |
| Range | 49.9% | 38.0% |
| Mean | 21.3% | 18.0% |
| Median | 18.4% | 16.2% |
| Interquartile 25% (IQ1) | 15.4% | 12.9% |
| Interquartile 75% (IQ3) | 25.9% | 21.0% |
| Interquartile Range (IQR) | 10.5% | 8.1% |
| Standard Deviation (Sample) | 11.0% | 8.3% |
| Standard Deviation (Population) | 10.9% | 8.2% |
Similar Demographics by Unemployment Among Ages 16 to 19 years
Demographics Similar to Immigrants from Ghana by Unemployment Among Ages 16 to 19 years
In terms of unemployment among ages 16 to 19 years, the demographic groups most similar to Immigrants from Ghana are Bahamian (19.8%, a difference of 0.060%), Immigrants from the Azores (19.8%, a difference of 0.12%), Ghanaian (19.8%, a difference of 0.19%), Pueblo (19.8%, a difference of 0.29%), and Sierra Leonean (19.7%, a difference of 0.37%).
| Demographics | Rating | Rank | Unemployment Among Ages 16 to 19 years |
| Cajuns | 0.0 /100 | #280 | Tragic 19.6% |
| Cypriots | 0.0 /100 | #281 | Tragic 19.6% |
| Dutch West Indians | 0.0 /100 | #282 | Tragic 19.7% |
| Sioux | 0.0 /100 | #283 | Tragic 19.7% |
| Sierra Leoneans | 0.0 /100 | #284 | Tragic 19.7% |
| Ghanaians | 0.0 /100 | #285 | Tragic 19.8% |
| Bahamians | 0.0 /100 | #286 | Tragic 19.8% |
| Immigrants | Ghana | 0.0 /100 | #287 | Tragic 19.8% |
| Immigrants | Azores | 0.0 /100 | #288 | Tragic 19.8% |
| Pueblo | 0.0 /100 | #289 | Tragic 19.8% |
| Immigrants | Sierra Leone | 0.0 /100 | #290 | Tragic 20.0% |
| Immigrants | Yemen | 0.0 /100 | #291 | Tragic 20.0% |
| Comanche | 0.0 /100 | #292 | Tragic 20.2% |
| Immigrants | Bahamas | 0.0 /100 | #293 | Tragic 20.4% |
| Immigrants | Haiti | 0.0 /100 | #294 | Tragic 20.4% |
Demographics Similar to Burmese by Unemployment Among Ages 16 to 19 years
In terms of unemployment among ages 16 to 19 years, the demographic groups most similar to Burmese are Immigrants from Lithuania (17.0%, a difference of 0.020%), Immigrants from Thailand (17.0%, a difference of 0.060%), Immigrants from Saudi Arabia (17.0%, a difference of 0.070%), Immigrants from Pakistan (17.0%, a difference of 0.090%), and Immigrants from Venezuela (16.9%, a difference of 0.10%).
| Demographics | Rating | Rank | Unemployment Among Ages 16 to 19 years |
| Cambodians | 96.3 /100 | #91 | Exceptional 16.9% |
| South Africans | 95.9 /100 | #92 | Exceptional 16.9% |
| Cubans | 95.8 /100 | #93 | Exceptional 16.9% |
| Bangladeshis | 95.8 /100 | #94 | Exceptional 16.9% |
| Mongolians | 95.6 /100 | #95 | Exceptional 16.9% |
| Ottawa | 95.4 /100 | #96 | Exceptional 16.9% |
| Immigrants | Venezuela | 95.3 /100 | #97 | Exceptional 16.9% |
| Burmese | 95.0 /100 | #98 | Exceptional 17.0% |
| Immigrants | Lithuania | 94.9 /100 | #99 | Exceptional 17.0% |
| Immigrants | Thailand | 94.7 /100 | #100 | Exceptional 17.0% |
| Immigrants | Saudi Arabia | 94.7 /100 | #101 | Exceptional 17.0% |
| Immigrants | Pakistan | 94.6 /100 | #102 | Exceptional 17.0% |
| Palestinians | 94.6 /100 | #103 | Exceptional 17.0% |
| Italians | 94.5 /100 | #104 | Exceptional 17.0% |
| Immigrants | Bulgaria | 94.3 /100 | #105 | Exceptional 17.0% |