Immigrants from Germany vs Laotian Unemployment Among Ages 16 to 19 years
COMPARE
Immigrants from Germany
Laotian
Unemployment Among Ages 16 to 19 years
Unemployment Among Ages 16 to 19 years Comparison
Immigrants from Germany
Laotians
17.2%
UNEMPLOYMENT AMONG AGES 16 TO 19 YEARS
87.7/ 100
METRIC RATING
125th/ 347
METRIC RANK
17.2%
UNEMPLOYMENT AMONG AGES 16 TO 19 YEARS
83.9/ 100
METRIC RATING
133rd/ 347
METRIC RANK
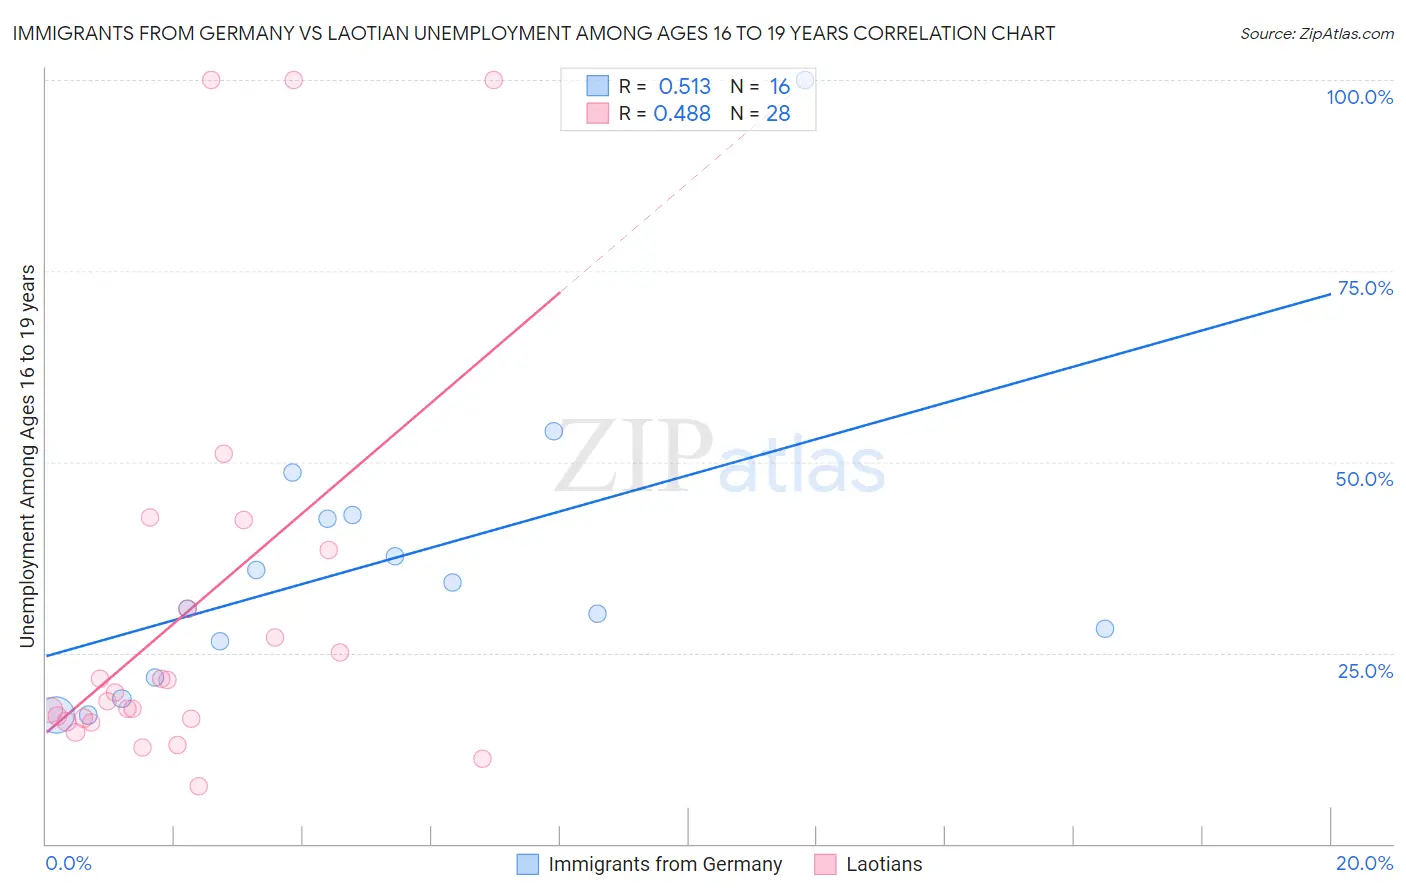
Immigrants from Germany vs Laotian Unemployment Among Ages 16 to 19 years Correlation Chart
The statistical analysis conducted on geographies consisting of 432,593,145 people shows a substantial positive correlation between the proportion of Immigrants from Germany and unemployment rate among population between the ages 16 and 19 in the United States with a correlation coefficient (R) of 0.513 and weighted average of 17.2%. Similarly, the statistical analysis conducted on geographies consisting of 218,682,979 people shows a moderate positive correlation between the proportion of Laotians and unemployment rate among population between the ages 16 and 19 in the United States with a correlation coefficient (R) of 0.488 and weighted average of 17.2%, a difference of 0.38%.
Unemployment Among Ages 16 to 19 years Correlation Summary
| Measurement | Immigrants from Germany | Laotian |
| Minimum | 16.9% | 7.5% |
| Maximum | 100.0% | 100.0% |
| Range | 83.1% | 92.5% |
| Mean | 36.6% | 30.5% |
| Median | 32.5% | 19.3% |
| Interquartile 25% (IQ1) | 24.1% | 16.2% |
| Interquartile 75% (IQ3) | 42.8% | 34.6% |
| Interquartile Range (IQR) | 18.7% | 18.5% |
| Standard Deviation (Sample) | 20.2% | 26.6% |
| Standard Deviation (Population) | 19.5% | 26.1% |
Demographics Similar to Immigrants from Germany and Laotians by Unemployment Among Ages 16 to 19 years
In terms of unemployment among ages 16 to 19 years, the demographic groups most similar to Immigrants from Germany are Immigrants from Bolivia (17.2%, a difference of 0.10%), Syrian (17.1%, a difference of 0.11%), Immigrants from Laos (17.1%, a difference of 0.13%), Pakistani (17.2%, a difference of 0.20%), and Australian (17.2%, a difference of 0.22%). Similarly, the demographic groups most similar to Laotians are Arab (17.2%, a difference of 0.010%), Potawatomi (17.2%, a difference of 0.010%), Samoan (17.2%, a difference of 0.010%), German Russian (17.2%, a difference of 0.020%), and Immigrants from Oceania (17.2%, a difference of 0.070%).
| Demographics | Rating | Rank | Unemployment Among Ages 16 to 19 years |
| Hungarians | 91.6 /100 | #119 | Exceptional 17.1% |
| Immigrants | Middle Africa | 90.9 /100 | #120 | Exceptional 17.1% |
| Immigrants | Moldova | 90.7 /100 | #121 | Exceptional 17.1% |
| Immigrants | South Eastern Asia | 90.7 /100 | #122 | Exceptional 17.1% |
| Immigrants | Laos | 88.8 /100 | #123 | Excellent 17.1% |
| Syrians | 88.6 /100 | #124 | Excellent 17.1% |
| Immigrants | Germany | 87.7 /100 | #125 | Excellent 17.2% |
| Immigrants | Bolivia | 86.7 /100 | #126 | Excellent 17.2% |
| Pakistanis | 85.8 /100 | #127 | Excellent 17.2% |
| Australians | 85.6 /100 | #128 | Excellent 17.2% |
| Creek | 85.5 /100 | #129 | Excellent 17.2% |
| Immigrants | Indonesia | 84.7 /100 | #130 | Excellent 17.2% |
| German Russians | 84.1 /100 | #131 | Excellent 17.2% |
| Arabs | 83.9 /100 | #132 | Excellent 17.2% |
| Laotians | 83.9 /100 | #133 | Excellent 17.2% |
| Potawatomi | 83.8 /100 | #134 | Excellent 17.2% |
| Samoans | 83.7 /100 | #135 | Excellent 17.2% |
| Immigrants | Oceania | 83.1 /100 | #136 | Excellent 17.2% |
| Immigrants | Malaysia | 82.8 /100 | #137 | Excellent 17.2% |
| Bolivians | 81.9 /100 | #138 | Excellent 17.3% |
| Immigrants | Eritrea | 81.1 /100 | #139 | Excellent 17.3% |