Immigrants from France vs Yuman Unemployment

COMPARE

Immigrants from France
Race
Ancestry
AfghanAfricanAlaska NativeAlaskan AthabascanAlbanianAleutAlsatianAmericanApacheArabArapahoArgentineanArmenianAssyrian/Chaldean/SyriacAustralianAustrianBahamianBangladeshiBarbadianBasqueBelgianBelizeanBermudanBhutaneseBlackfeetBolivianBrazilianBritishBritish West IndianBulgarianBurmeseCajunCambodianCanadianCape VerdeanCarpatho RusynCelticCentral AmericanCentral American IndianCherokeeCheyenneChickasawChileanChineseChippewaChoctawColombianColvilleComancheCosta RicanCreeCreekCroatianCrowCubanCypriotCzechCzechoslovakianDanishDelawareDominicanDutchDutch West IndianEastern EuropeanEcuadorianEgyptianEnglishEstonianEthiopianEuropeanFijianFilipinoFinnishFrenchFrench American IndianFrench CanadianGermanGerman RussianGhanaianGreekGuamanian/ChamorroGuatemalanGuyaneseHaitianHmongHonduranHopiHoumaHungarianIcelanderIndian (Asian)IndonesianInupiatIranianIraqiIrishIroquoisIsraeliItalianJamaicanJapaneseJordanianKenyanKiowaKoreanLaotianLatvianLebaneseLiberianLithuanianLumbeeLuxembourgerMacedonianMalaysianMalteseMarshalleseMenomineeMexicanMexican American IndianMongolianMoroccanNative HawaiianNavajoNepaleseNew ZealanderNicaraguanNigerianNorthern EuropeanNorwegianOkinawanOsageOttawaPaiutePakistaniPalestinianPanamanianParaguayanPennsylvania GermanPeruvianPimaPolishPortuguesePotawatomiPuebloPuerto RicanPuget Sound SalishRomanianRussianSalvadoranSamoanScandinavianScotch-IrishScottishSeminoleSenegaleseSerbianShoshoneSierra LeoneanSiouxSlavicSlovakSloveneSomaliSouth AfricanSouth AmericanSouth American IndianSoviet UnionSpaniardSpanishSpanish AmericanSpanish American IndianSri LankanSubsaharan AfricanSudaneseSwedishSwissSyrianTaiwaneseThaiTlingit-HaidaTohono O'OdhamTonganTrinidadian and TobagonianTsimshianTurkishU.S. Virgin IslanderUgandanUkrainianUruguayanUteVenezuelanVietnameseWelshWest IndianYakamaYaquiYugoslavianYup'ikZimbabwean
Immigration
NonimmigrantsImmigrantsAfghanistanAfricaAlbaniaArgentinaArmeniaAsiaAustraliaAustriaBahamasBangladeshBarbadosBelarusBelgiumBelizeBoliviaBosnia and HerzegovinaBrazilBulgariaBurma/MyanmarCabo VerdeCambodiaCameroonCanadaCaribbeanCentral AmericaChileChinaColombiaCongoCosta RicaCroatiaCubaCzechoslovakiaDenmarkDominicaDominican RepublicEastern AfricaEastern AsiaEastern EuropeEcuadorEgyptEl SalvadorEnglandEritreaEthiopiaEuropeFijiFranceGermanyGhanaGreeceGrenadaGuatemalaGuyanaHaitiHondurasHong KongHungaryIndiaIndonesiaIranIraqIrelandIsraelItalyJamaicaJapanJordanKazakhstanKenyaKoreaKuwaitLaosLatin AmericaLatviaLebanonLiberiaLithuaniaMalaysiaMexicoMicronesiaMiddle AfricaMoldovaMoroccoNepalNetherlandsNicaraguaNigeriaNorth AmericaNorth MacedoniaNorthern AfricaNorthern EuropeNorwayOceaniaPakistanPanamaPeruPhilippinesPolandPortugalRomaniaRussiaSaudi ArabiaScotlandSenegalSerbiaSierra LeoneSingaporeSomaliaSouth AfricaSouth AmericaSouth Central AsiaSouth Eastern AsiaSouthern EuropeSpainSri LankaSt. Vincent and the GrenadinesSudanSwedenSwitzerlandSyriaTaiwanThailandTrinidad and TobagoTurkeyUgandaUkraineUruguayUzbekistanVenezuelaVietnamWest IndiesWestern AfricaWestern AsiaWestern EuropeYemenZaireZimbabweAzores
Yuman
Race
Ancestry
AfghanAfricanAlaska NativeAlaskan AthabascanAlbanianAleutAlsatianAmericanApacheArabArapahoArgentineanArmenianAssyrian/Chaldean/SyriacAustralianAustrianBahamianBangladeshiBarbadianBasqueBelgianBelizeanBermudanBhutaneseBlackfeetBolivianBrazilianBritishBritish West IndianBulgarianBurmeseCajunCambodianCanadianCape VerdeanCarpatho RusynCelticCentral AmericanCentral American IndianCherokeeCheyenneChickasawChileanChineseChippewaChoctawColombianColvilleComancheCosta RicanCreeCreekCroatianCrowCubanCypriotCzechCzechoslovakianDanishDelawareDominicanDutchDutch West IndianEastern EuropeanEcuadorianEgyptianEnglishEstonianEthiopianEuropeanFijianFilipinoFinnishFrenchFrench American IndianFrench CanadianGermanGerman RussianGhanaianGreekGuamanian/ChamorroGuatemalanGuyaneseHaitianHmongHonduranHopiHoumaHungarianIcelanderIndian (Asian)IndonesianInupiatIranianIraqiIrishIroquoisIsraeliItalianJamaicanJapaneseJordanianKenyanKiowaKoreanLaotianLatvianLebaneseLiberianLithuanianLumbeeLuxembourgerMacedonianMalaysianMalteseMarshalleseMenomineeMexicanMexican American IndianMongolianMoroccanNative HawaiianNavajoNepaleseNew ZealanderNicaraguanNigerianNorthern EuropeanNorwegianOkinawanOsageOttawaPaiutePakistaniPalestinianPanamanianParaguayanPennsylvania GermanPeruvianPimaPolishPortuguesePotawatomiPuebloPuerto RicanPuget Sound SalishRomanianRussianSalvadoranSamoanScandinavianScotch-IrishScottishSeminoleSenegaleseSerbianShoshoneSierra LeoneanSiouxSlavicSlovakSloveneSomaliSouth AfricanSouth AmericanSouth American IndianSoviet UnionSpaniardSpanishSpanish AmericanSpanish American IndianSri LankanSubsaharan AfricanSudaneseSwedishSwissSyrianTaiwaneseThaiTlingit-HaidaTohono O'OdhamTonganTrinidadian and TobagonianTsimshianTurkishU.S. Virgin IslanderUgandanUkrainianUruguayanUteVenezuelanVietnameseWelshWest IndianYakamaYaquiYugoslavianYumanYup'ikZimbabwean
Immigration
NonimmigrantsImmigrantsAfghanistanAfricaAlbaniaArgentinaArmeniaAsiaAustraliaAustriaBahamasBangladeshBarbadosBelarusBelgiumBelizeBoliviaBosnia and HerzegovinaBrazilBulgariaBurma/MyanmarCabo VerdeCambodiaCameroonCanadaCaribbeanCentral AmericaChileChinaColombiaCongoCosta RicaCroatiaCubaCzechoslovakiaDenmarkDominicaDominican RepublicEastern AfricaEastern AsiaEastern EuropeEcuadorEgyptEl SalvadorEnglandEritreaEthiopiaEuropeFijiGermanyGhanaGreeceGrenadaGuatemalaGuyanaHaitiHondurasHong KongHungaryIndiaIndonesiaIranIraqIrelandIsraelItalyJamaicaJapanJordanKazakhstanKenyaKoreaKuwaitLaosLatin AmericaLatviaLebanonLiberiaLithuaniaMalaysiaMexicoMicronesiaMiddle AfricaMoldovaMoroccoNepalNetherlandsNicaraguaNigeriaNorth AmericaNorth MacedoniaNorthern AfricaNorthern EuropeNorwayOceaniaPakistanPanamaPeruPhilippinesPolandPortugalRomaniaRussiaSaudi ArabiaScotlandSenegalSerbiaSierra LeoneSingaporeSomaliaSouth AfricaSouth AmericaSouth Central AsiaSouth Eastern AsiaSouthern EuropeSpainSri LankaSt. Vincent and the GrenadinesSudanSwedenSwitzerlandSyriaTaiwanThailandTrinidad and TobagoTurkeyUgandaUkraineUruguayUzbekistanVenezuelaVietnamWest IndiesWestern AfricaWestern AsiaWestern EuropeYemenZaireZimbabweAzores
Unemployment
Income
Poverty
Unemployment
Labor Participation
Family Structure
Vehicle Availability
Education Level
Disability

Unemployment Comparison

Immigrants from France

Yuman

Excellent
Tragic
5.1%
UNEMPLOYMENT
89.7/ 100
METRIC RATING
119th/ 347
METRIC RANK
9.1%
UNEMPLOYMENT
0.0/ 100
METRIC RATING
343rd/ 347
METRIC RANK

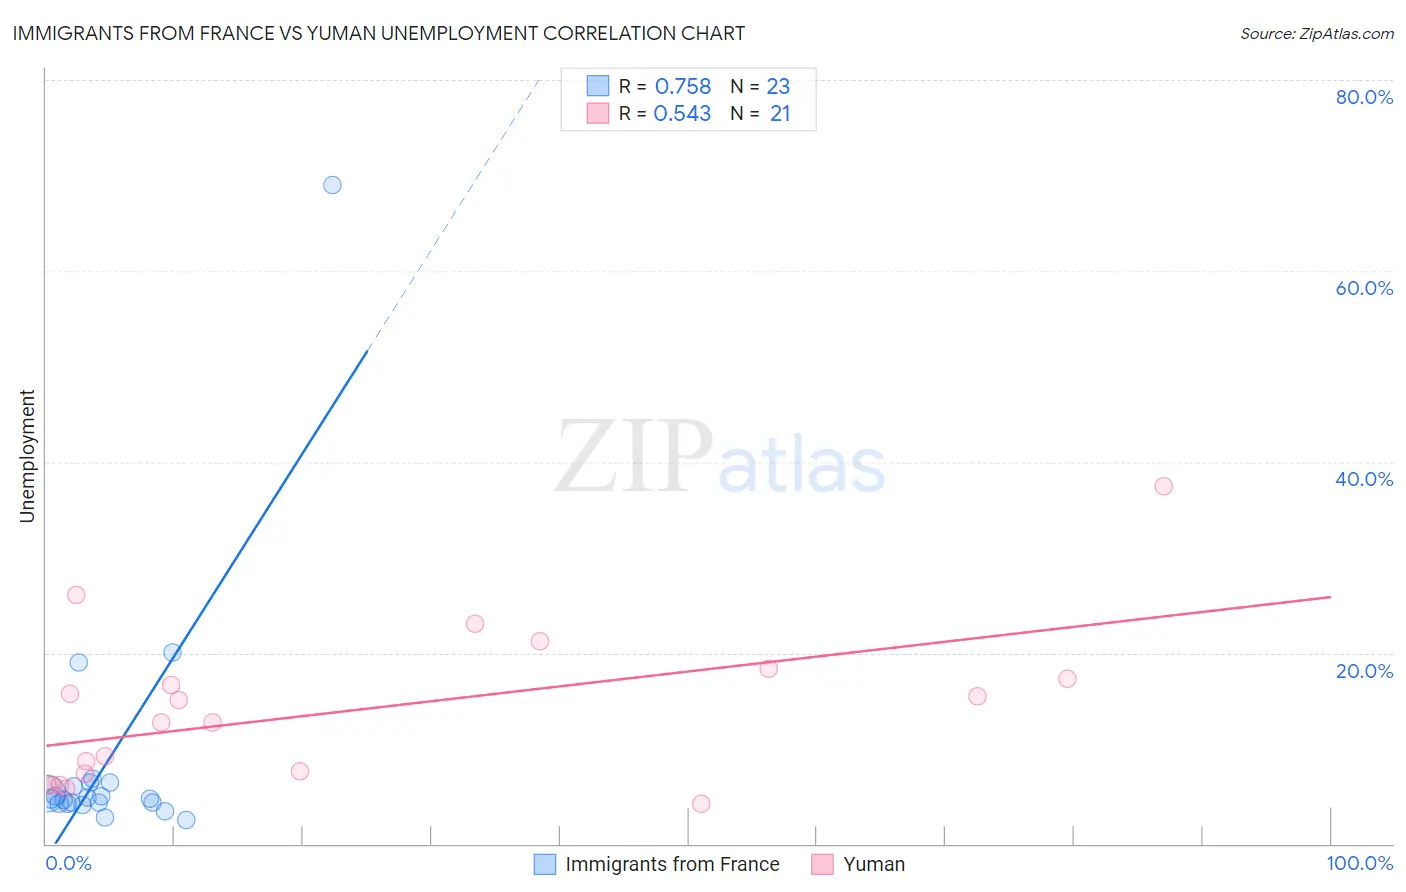
Immigrants from France vs Yuman Unemployment Correlation Chart

The statistical analysis conducted on geographies consisting of 287,750,590 people shows a strong positive correlation between the proportion of Immigrants from France and unemployment in the United States with a correlation coefficient (R) of 0.758 and weighted average of 5.1%. Similarly, the statistical analysis conducted on geographies consisting of 40,662,591 people shows a substantial positive correlation between the proportion of Yuman and unemployment in the United States with a correlation coefficient (R) of 0.543 and weighted average of 9.1%, a difference of 78.3%.
Immigrants from France vs Yuman Unemployment

Unemployment Correlation Summary

MeasurementImmigrants from FranceYuman
Minimum2.5%4.2%
Maximum69.0%37.5%
Range66.5%33.3%
Mean8.8%14.0%
Median4.7%12.7%
Interquartile 25% (IQ1)4.2%6.8%
Interquartile 75% (IQ3)6.4%17.8%
Interquartile Range (IQR)2.2%11.0%
Standard Deviation (Sample)13.8%8.3%
Standard Deviation (Population)13.5%8.1%

Similar Demographics by Unemployment

Demographics Similar to Immigrants from France by Unemployment

In terms of unemployment, the demographic groups most similar to Immigrants from France are Macedonian (5.1%, a difference of 0.010%), Lebanese (5.1%, a difference of 0.080%), Immigrants from Switzerland (5.1%, a difference of 0.090%), Asian (5.1%, a difference of 0.12%), and Ethiopian (5.1%, a difference of 0.17%).
DemographicsRating | RankUnemployment
South Africans
92.6
/100
|
#112
Exceptional
5.1%
Argentineans
92.4
/100
|
#113
Exceptional
5.1%
Immigrants | Ireland
92.1
/100
|
#114
Exceptional
5.1%
Immigrants | Western Europe
91.1
/100
|
#115
Exceptional
5.1%
Immigrants | Sri Lanka
91.1
/100
|
#116
Exceptional
5.1%
Immigrants | Malaysia
91.0
/100
|
#117
Exceptional
5.1%
Immigrants | Germany
90.8
/100
|
#118
Exceptional
5.1%
Immigrants | France
89.7
/100
|
#119
Excellent
5.1%
Macedonians
89.7
/100
|
#120
Excellent
5.1%
Lebanese
89.2
/100
|
#121
Excellent
5.1%
Immigrants | Switzerland
89.1
/100
|
#122
Excellent
5.1%
Asians
89.0
/100
|
#123
Excellent
5.1%
Ethiopians
88.6
/100
|
#124
Excellent
5.1%
Immigrants | Eastern Asia
88.3
/100
|
#125
Excellent
5.1%
Kenyans
88.2
/100
|
#126
Excellent
5.1%

Demographics Similar to Yuman by Unemployment

In terms of unemployment, the demographic groups most similar to Yuman are Hopi (8.9%, a difference of 1.7%), Tohono O'odham (8.9%, a difference of 2.1%), Puerto Rican (8.4%, a difference of 7.7%), Arapaho (9.8%, a difference of 8.4%), and Navajo (8.4%, a difference of 8.5%).
DemographicsRating | RankUnemployment
Immigrants | Dominican Republic
0.0
/100
|
#333
Tragic
7.4%
Apache
0.0
/100
|
#334
Tragic
7.4%
Alaskan Athabascans
0.0
/100
|
#335
Tragic
7.7%
Immigrants | Yemen
0.0
/100
|
#336
Tragic
7.7%
Cheyenne
0.0
/100
|
#337
Tragic
8.0%
Pima
0.0
/100
|
#338
Tragic
8.2%
Navajo
0.0
/100
|
#339
Tragic
8.4%
Puerto Ricans
0.0
/100
|
#340
Tragic
8.4%
Tohono O'odham
0.0
/100
|
#341
Tragic
8.9%
Hopi
0.0
/100
|
#342
Tragic
8.9%
Yuman
0.0
/100
|
#343
Tragic
9.1%
Arapaho
0.0
/100
|
#344
Tragic
9.8%
Inupiat
0.0
/100
|
#345
Tragic
10.1%
Crow
0.0
/100
|
#346
Tragic
11.1%
Yup'ik
0.0
/100
|
#347
Tragic
13.6%