Immigrants from France vs Mexican Unemployment Among Ages 30 to 34 years

COMPARE

Immigrants from France
Race
Ancestry
AfghanAfricanAlaska NativeAlaskan AthabascanAlbanianAleutAlsatianAmericanApacheArabArapahoArgentineanArmenianAssyrian/Chaldean/SyriacAustralianAustrianBahamianBangladeshiBarbadianBasqueBelgianBelizeanBermudanBhutaneseBlackfeetBolivianBrazilianBritishBritish West IndianBulgarianBurmeseCajunCambodianCanadianCape VerdeanCarpatho RusynCelticCentral AmericanCentral American IndianCherokeeCheyenneChickasawChileanChineseChippewaChoctawColombianColvilleComancheCosta RicanCreeCreekCroatianCrowCubanCypriotCzechCzechoslovakianDanishDelawareDominicanDutchDutch West IndianEastern EuropeanEcuadorianEgyptianEnglishEstonianEthiopianEuropeanFijianFilipinoFinnishFrenchFrench American IndianFrench CanadianGermanGerman RussianGhanaianGreekGuamanian/ChamorroGuatemalanGuyaneseHaitianHmongHonduranHopiHoumaHungarianIcelanderIndian (Asian)IndonesianInupiatIranianIraqiIrishIroquoisIsraeliItalianJamaicanJapaneseJordanianKenyanKiowaKoreanLaotianLatvianLebaneseLiberianLithuanianLumbeeLuxembourgerMacedonianMalaysianMalteseMarshalleseMenomineeMexican American IndianMongolianMoroccanNative HawaiianNavajoNepaleseNew ZealanderNicaraguanNigerianNorthern EuropeanNorwegianOkinawanOsageOttawaPaiutePakistaniPalestinianPanamanianParaguayanPennsylvania GermanPeruvianPimaPolishPortuguesePotawatomiPuebloPuerto RicanPuget Sound SalishRomanianRussianSalvadoranSamoanScandinavianScotch-IrishScottishSeminoleSenegaleseSerbianShoshoneSierra LeoneanSiouxSlavicSlovakSloveneSomaliSouth AfricanSouth AmericanSouth American IndianSoviet UnionSpaniardSpanishSpanish AmericanSpanish American IndianSri LankanSubsaharan AfricanSudaneseSwedishSwissSyrianTaiwaneseThaiTlingit-HaidaTohono O'OdhamTonganTrinidadian and TobagonianTsimshianTurkishU.S. Virgin IslanderUgandanUkrainianUruguayanUteVenezuelanVietnameseWelshWest IndianYakamaYaquiYugoslavianYumanYup'ikZimbabwean
Immigration
NonimmigrantsImmigrantsAfghanistanAfricaAlbaniaArgentinaArmeniaAsiaAustraliaAustriaBahamasBangladeshBarbadosBelarusBelgiumBelizeBoliviaBosnia and HerzegovinaBrazilBulgariaBurma/MyanmarCabo VerdeCambodiaCameroonCanadaCaribbeanCentral AmericaChileChinaColombiaCongoCosta RicaCroatiaCubaCzechoslovakiaDenmarkDominicaDominican RepublicEastern AfricaEastern AsiaEastern EuropeEcuadorEgyptEl SalvadorEnglandEritreaEthiopiaEuropeFijiFranceGermanyGhanaGreeceGrenadaGuatemalaGuyanaHaitiHondurasHong KongHungaryIndiaIndonesiaIranIraqIrelandIsraelItalyJamaicaJapanJordanKazakhstanKenyaKoreaKuwaitLaosLatin AmericaLatviaLebanonLiberiaLithuaniaMalaysiaMexicoMicronesiaMiddle AfricaMoldovaMoroccoNepalNetherlandsNicaraguaNigeriaNorth AmericaNorth MacedoniaNorthern AfricaNorthern EuropeNorwayOceaniaPakistanPanamaPeruPhilippinesPolandPortugalRomaniaRussiaSaudi ArabiaScotlandSenegalSerbiaSierra LeoneSingaporeSomaliaSouth AfricaSouth AmericaSouth Central AsiaSouth Eastern AsiaSouthern EuropeSpainSri LankaSt. Vincent and the GrenadinesSudanSwedenSwitzerlandSyriaTaiwanThailandTrinidad and TobagoTurkeyUgandaUkraineUruguayUzbekistanVenezuelaVietnamWest IndiesWestern AfricaWestern AsiaWestern EuropeYemenZaireZimbabweAzores
Mexican
Race
Ancestry
AfghanAfricanAlaska NativeAlaskan AthabascanAlbanianAleutAlsatianAmericanApacheArabArapahoArgentineanArmenianAssyrian/Chaldean/SyriacAustralianAustrianBahamianBangladeshiBarbadianBasqueBelgianBelizeanBermudanBhutaneseBlackfeetBolivianBrazilianBritishBritish West IndianBulgarianBurmeseCajunCambodianCanadianCape VerdeanCarpatho RusynCelticCentral AmericanCentral American IndianCherokeeCheyenneChickasawChileanChineseChippewaChoctawColombianColvilleComancheCosta RicanCreeCreekCroatianCrowCubanCypriotCzechCzechoslovakianDanishDelawareDominicanDutchDutch West IndianEastern EuropeanEcuadorianEgyptianEnglishEstonianEthiopianEuropeanFijianFilipinoFinnishFrenchFrench American IndianFrench CanadianGermanGerman RussianGhanaianGreekGuamanian/ChamorroGuatemalanGuyaneseHaitianHmongHonduranHopiHoumaHungarianIcelanderIndian (Asian)IndonesianInupiatIranianIraqiIrishIroquoisIsraeliItalianJamaicanJapaneseJordanianKenyanKiowaKoreanLaotianLatvianLebaneseLiberianLithuanianLumbeeLuxembourgerMacedonianMalaysianMalteseMarshalleseMenomineeMexicanMexican American IndianMongolianMoroccanNative HawaiianNavajoNepaleseNew ZealanderNicaraguanNigerianNorthern EuropeanNorwegianOkinawanOsageOttawaPaiutePakistaniPalestinianPanamanianParaguayanPennsylvania GermanPeruvianPimaPolishPortuguesePotawatomiPuebloPuerto RicanPuget Sound SalishRomanianRussianSalvadoranSamoanScandinavianScotch-IrishScottishSeminoleSenegaleseSerbianShoshoneSierra LeoneanSiouxSlavicSlovakSloveneSomaliSouth AfricanSouth AmericanSouth American IndianSoviet UnionSpaniardSpanishSpanish AmericanSpanish American IndianSri LankanSubsaharan AfricanSudaneseSwedishSwissSyrianTaiwaneseThaiTlingit-HaidaTohono O'OdhamTonganTrinidadian and TobagonianTsimshianTurkishU.S. Virgin IslanderUgandanUkrainianUruguayanUteVenezuelanVietnameseWelshWest IndianYakamaYaquiYugoslavianYumanYup'ikZimbabwean
Immigration
NonimmigrantsImmigrantsAfghanistanAfricaAlbaniaArgentinaArmeniaAsiaAustraliaAustriaBahamasBangladeshBarbadosBelarusBelgiumBelizeBoliviaBosnia and HerzegovinaBrazilBulgariaBurma/MyanmarCabo VerdeCambodiaCameroonCanadaCaribbeanCentral AmericaChileChinaColombiaCongoCosta RicaCroatiaCubaCzechoslovakiaDenmarkDominicaDominican RepublicEastern AfricaEastern AsiaEastern EuropeEcuadorEgyptEl SalvadorEnglandEritreaEthiopiaEuropeFijiGermanyGhanaGreeceGrenadaGuatemalaGuyanaHaitiHondurasHong KongHungaryIndiaIndonesiaIranIraqIrelandIsraelItalyJamaicaJapanJordanKazakhstanKenyaKoreaKuwaitLaosLatin AmericaLatviaLebanonLiberiaLithuaniaMalaysiaMexicoMicronesiaMiddle AfricaMoldovaMoroccoNepalNetherlandsNicaraguaNigeriaNorth AmericaNorth MacedoniaNorthern AfricaNorthern EuropeNorwayOceaniaPakistanPanamaPeruPhilippinesPolandPortugalRomaniaRussiaSaudi ArabiaScotlandSenegalSerbiaSierra LeoneSingaporeSomaliaSouth AfricaSouth AmericaSouth Central AsiaSouth Eastern AsiaSouthern EuropeSpainSri LankaSt. Vincent and the GrenadinesSudanSwedenSwitzerlandSyriaTaiwanThailandTrinidad and TobagoTurkeyUgandaUkraineUruguayUzbekistanVenezuelaVietnamWest IndiesWestern AfricaWestern AsiaWestern EuropeYemenZaireZimbabweAzores
Unemployment Among Ages 30 to 34 years
Income
Poverty
Unemployment
Labor Participation
Family Structure
Vehicle Availability
Education Level
Disability

Unemployment Among Ages 30 to 34 years Comparison

Immigrants from France

Mexicans

Exceptional
Tragic
5.1%
UNEMPLOYMENT AMONG AGES 30 TO 34 YEARS
97.0/ 100
METRIC RATING
62nd/ 347
METRIC RANK
6.1%
UNEMPLOYMENT AMONG AGES 30 TO 34 YEARS
0.1/ 100
METRIC RATING
258th/ 347
METRIC RANK

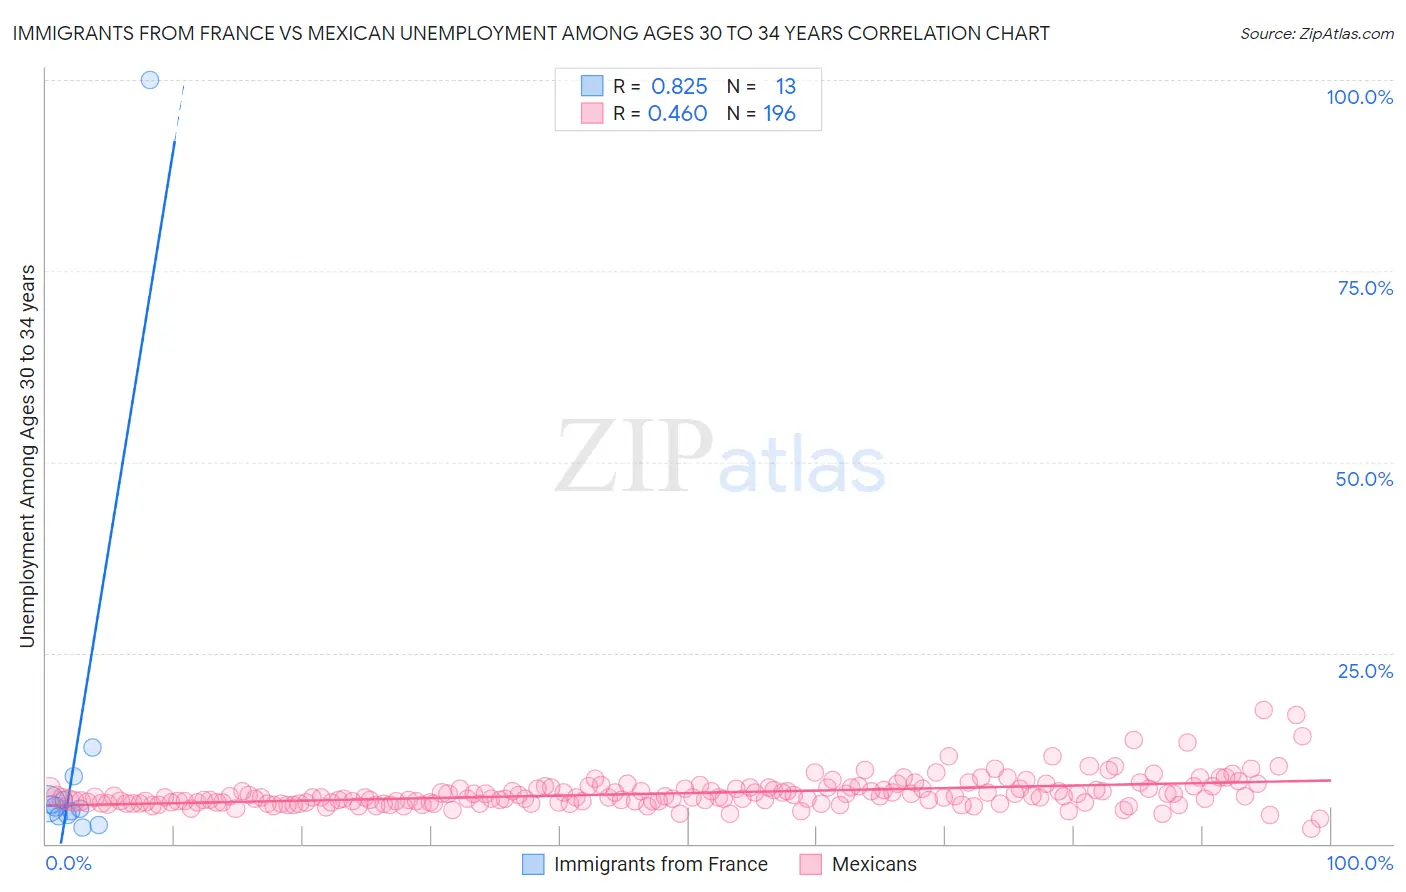
Immigrants from France vs Mexican Unemployment Among Ages 30 to 34 years Correlation Chart

The statistical analysis conducted on geographies consisting of 276,101,474 people shows a very strong positive correlation between the proportion of Immigrants from France and unemployment rate among population between the ages 30 and 34 in the United States with a correlation coefficient (R) of 0.825 and weighted average of 5.1%. Similarly, the statistical analysis conducted on geographies consisting of 497,857,955 people shows a moderate positive correlation between the proportion of Mexicans and unemployment rate among population between the ages 30 and 34 in the United States with a correlation coefficient (R) of 0.460 and weighted average of 6.1%, a difference of 19.5%.
Immigrants from France vs Mexican Unemployment Among Ages 30 to 34 years

Unemployment Among Ages 30 to 34 years Correlation Summary

MeasurementImmigrants from FranceMexican
Minimum2.2%2.0%
Maximum100.0%17.6%
Range97.8%15.6%
Mean12.6%6.6%
Median4.8%6.1%
Interquartile 25% (IQ1)3.7%5.4%
Interquartile 75% (IQ3)7.2%7.3%
Interquartile Range (IQR)3.5%1.9%
Standard Deviation (Sample)26.4%2.0%
Standard Deviation (Population)25.4%2.0%

Similar Demographics by Unemployment Among Ages 30 to 34 years

Demographics Similar to Immigrants from France by Unemployment Among Ages 30 to 34 years

In terms of unemployment among ages 30 to 34 years, the demographic groups most similar to Immigrants from France are Belgian (5.1%, a difference of 0.010%), Indian (Asian) (5.1%, a difference of 0.020%), Immigrants from Eastern Asia (5.1%, a difference of 0.030%), Swedish (5.1%, a difference of 0.050%), and Immigrants from Somalia (5.1%, a difference of 0.050%).
DemographicsRating | RankUnemployment Among Ages 30 to 34 years
Chinese
97.7
/100
|
#55
Exceptional
5.1%
Immigrants | Serbia
97.4
/100
|
#56
Exceptional
5.1%
Immigrants | China
97.2
/100
|
#57
Exceptional
5.1%
Asians
97.2
/100
|
#58
Exceptional
5.1%
Swedes
97.1
/100
|
#59
Exceptional
5.1%
Immigrants | Somalia
97.1
/100
|
#60
Exceptional
5.1%
Indians (Asian)
97.0
/100
|
#61
Exceptional
5.1%
Immigrants | France
97.0
/100
|
#62
Exceptional
5.1%
Belgians
97.0
/100
|
#63
Exceptional
5.1%
Immigrants | Eastern Asia
96.9
/100
|
#64
Exceptional
5.1%
Immigrants | Japan
96.8
/100
|
#65
Exceptional
5.1%
Immigrants | Zimbabwe
96.7
/100
|
#66
Exceptional
5.1%
Burmese
96.5
/100
|
#67
Exceptional
5.1%
Jordanians
96.5
/100
|
#68
Exceptional
5.1%
Immigrants | Northern Africa
96.4
/100
|
#69
Exceptional
5.1%

Demographics Similar to Mexicans by Unemployment Among Ages 30 to 34 years

In terms of unemployment among ages 30 to 34 years, the demographic groups most similar to Mexicans are Immigrants from Sierra Leone (6.1%, a difference of 0.070%), Haitian (6.1%, a difference of 0.080%), Immigrants from Ghana (6.1%, a difference of 0.10%), Immigrants from Portugal (6.1%, a difference of 0.30%), and Immigrants from Latin America (6.1%, a difference of 0.30%).
DemographicsRating | RankUnemployment Among Ages 30 to 34 years
Tlingit-Haida
0.2
/100
|
#251
Tragic
6.0%
Potawatomi
0.2
/100
|
#252
Tragic
6.0%
Immigrants | Nonimmigrants
0.2
/100
|
#253
Tragic
6.1%
Armenians
0.1
/100
|
#254
Tragic
6.1%
Immigrants | Portugal
0.1
/100
|
#255
Tragic
6.1%
Immigrants | Ghana
0.1
/100
|
#256
Tragic
6.1%
Immigrants | Sierra Leone
0.1
/100
|
#257
Tragic
6.1%
Mexicans
0.1
/100
|
#258
Tragic
6.1%
Haitians
0.1
/100
|
#259
Tragic
6.1%
Immigrants | Latin America
0.1
/100
|
#260
Tragic
6.1%
Immigrants | Western Africa
0.1
/100
|
#261
Tragic
6.2%
Immigrants | Central America
0.1
/100
|
#262
Tragic
6.2%
Spanish Americans
0.0
/100
|
#263
Tragic
6.2%
Chickasaw
0.0
/100
|
#264
Tragic
6.2%
Americans
0.0
/100
|
#265
Tragic
6.2%