Immigrants from France vs Brazilian Unemployment Among Youth under 25 years
COMPARE
Immigrants from France
Brazilian
Unemployment Among Youth under 25 years
Unemployment Among Youth under 25 years Comparison
Immigrants from France
Brazilians
11.3%
UNEMPLOYMENT AMONG YOUTH UNDER 25 YEARS
90.3/ 100
METRIC RATING
111th/ 347
METRIC RANK
11.5%
UNEMPLOYMENT AMONG YOUTH UNDER 25 YEARS
72.5/ 100
METRIC RATING
146th/ 347
METRIC RANK
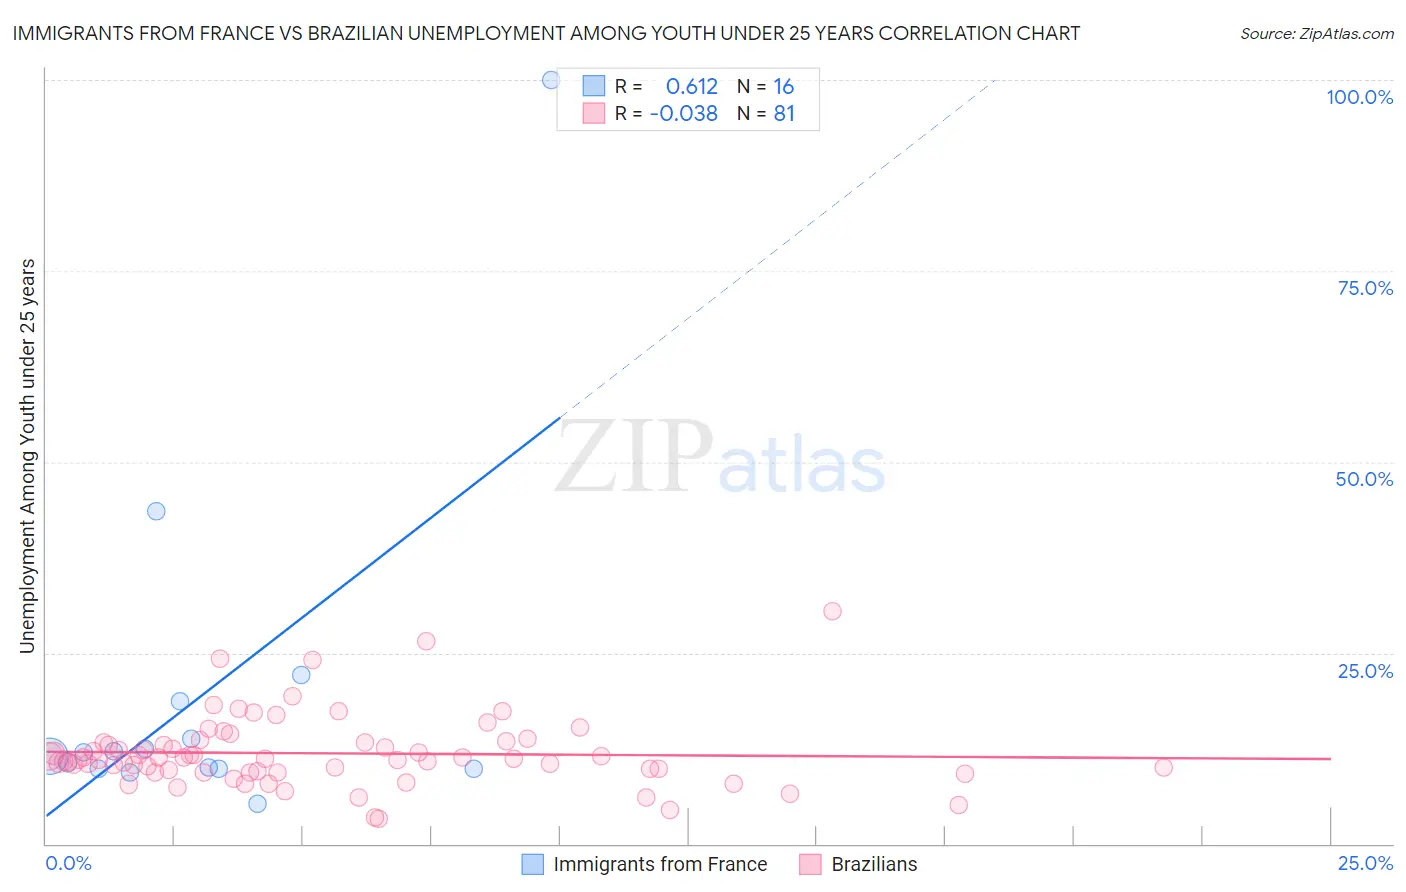
Immigrants from France vs Brazilian Unemployment Among Youth under 25 years Correlation Chart
The statistical analysis conducted on geographies consisting of 285,266,169 people shows a significant positive correlation between the proportion of Immigrants from France and unemployment rate among youth under the age of 25 in the United States with a correlation coefficient (R) of 0.612 and weighted average of 11.3%. Similarly, the statistical analysis conducted on geographies consisting of 321,254,906 people shows no correlation between the proportion of Brazilians and unemployment rate among youth under the age of 25 in the United States with a correlation coefficient (R) of -0.038 and weighted average of 11.5%, a difference of 1.3%.
Unemployment Among Youth under 25 years Correlation Summary
| Measurement | Immigrants from France | Brazilian |
| Minimum | 5.3% | 3.2% |
| Maximum | 100.0% | 30.5% |
| Range | 94.7% | 27.3% |
| Mean | 19.4% | 11.8% |
| Median | 11.7% | 11.1% |
| Interquartile 25% (IQ1) | 9.8% | 9.5% |
| Interquartile 75% (IQ3) | 16.2% | 13.3% |
| Interquartile Range (IQR) | 6.4% | 3.8% |
| Standard Deviation (Sample) | 23.2% | 4.7% |
| Standard Deviation (Population) | 22.5% | 4.6% |
Similar Demographics by Unemployment Among Youth under 25 years
Demographics Similar to Immigrants from France by Unemployment Among Youth under 25 years
In terms of unemployment among youth under 25 years, the demographic groups most similar to Immigrants from France are Immigrants from Austria (11.3%, a difference of 0.0%), Fijian (11.3%, a difference of 0.010%), Immigrants from Ethiopia (11.3%, a difference of 0.040%), Immigrants from Vietnam (11.3%, a difference of 0.050%), and Burmese (11.3%, a difference of 0.060%).
| Demographics | Rating | Rank | Unemployment Among Youth under 25 years |
| Immigrants | Afghanistan | 93.4 /100 | #104 | Exceptional 11.3% |
| Immigrants | Jordan | 93.1 /100 | #105 | Exceptional 11.3% |
| Chileans | 93.0 /100 | #106 | Exceptional 11.3% |
| Immigrants | Lithuania | 92.9 /100 | #107 | Exceptional 11.3% |
| Immigrants | Kuwait | 92.9 /100 | #108 | Exceptional 11.3% |
| Iranians | 92.0 /100 | #109 | Exceptional 11.3% |
| Immigrants | Norway | 91.5 /100 | #110 | Exceptional 11.3% |
| Immigrants | France | 90.3 /100 | #111 | Exceptional 11.3% |
| Immigrants | Austria | 90.3 /100 | #112 | Exceptional 11.3% |
| Fijians | 90.2 /100 | #113 | Exceptional 11.3% |
| Immigrants | Ethiopia | 89.9 /100 | #114 | Excellent 11.3% |
| Immigrants | Vietnam | 89.9 /100 | #115 | Excellent 11.3% |
| Burmese | 89.8 /100 | #116 | Excellent 11.3% |
| Sri Lankans | 89.8 /100 | #117 | Excellent 11.3% |
| Afghans | 89.7 /100 | #118 | Excellent 11.3% |
Demographics Similar to Brazilians by Unemployment Among Youth under 25 years
In terms of unemployment among youth under 25 years, the demographic groups most similar to Brazilians are Laotian (11.5%, a difference of 0.0%), Argentinean (11.5%, a difference of 0.020%), Immigrants from Northern Europe (11.5%, a difference of 0.020%), Immigrants from Cambodia (11.5%, a difference of 0.040%), and Immigrants from Switzerland (11.5%, a difference of 0.050%).
| Demographics | Rating | Rank | Unemployment Among Youth under 25 years |
| Immigrants | Indonesia | 77.6 /100 | #139 | Good 11.5% |
| Immigrants | Belgium | 77.5 /100 | #140 | Good 11.5% |
| Immigrants | Uruguay | 76.1 /100 | #141 | Good 11.5% |
| Immigrants | Korea | 75.1 /100 | #142 | Good 11.5% |
| Immigrants | Uganda | 74.5 /100 | #143 | Good 11.5% |
| Immigrants | Brazil | 74.3 /100 | #144 | Good 11.5% |
| Argentineans | 73.0 /100 | #145 | Good 11.5% |
| Brazilians | 72.5 /100 | #146 | Good 11.5% |
| Laotians | 72.4 /100 | #147 | Good 11.5% |
| Immigrants | Northern Europe | 72.1 /100 | #148 | Good 11.5% |
| Immigrants | Cambodia | 71.8 /100 | #149 | Good 11.5% |
| Immigrants | Switzerland | 71.6 /100 | #150 | Good 11.5% |
| Uruguayans | 70.4 /100 | #151 | Good 11.5% |
| Iraqis | 68.3 /100 | #152 | Good 11.5% |
| Immigrants | Czechoslovakia | 67.1 /100 | #153 | Good 11.5% |