Immigrants from Ethiopia vs Yugoslavian Unemployment Among Ages 20 to 24 years
COMPARE
Immigrants from Ethiopia
Yugoslavian
Unemployment Among Ages 20 to 24 years
Unemployment Among Ages 20 to 24 years Comparison
Immigrants from Ethiopia
Yugoslavians
9.6%
UNEMPLOYMENT AMONG AGES 20 TO 24 YEARS
99.9/ 100
METRIC RATING
40th/ 347
METRIC RANK
9.6%
UNEMPLOYMENT AMONG AGES 20 TO 24 YEARS
100.0/ 100
METRIC RATING
34th/ 347
METRIC RANK
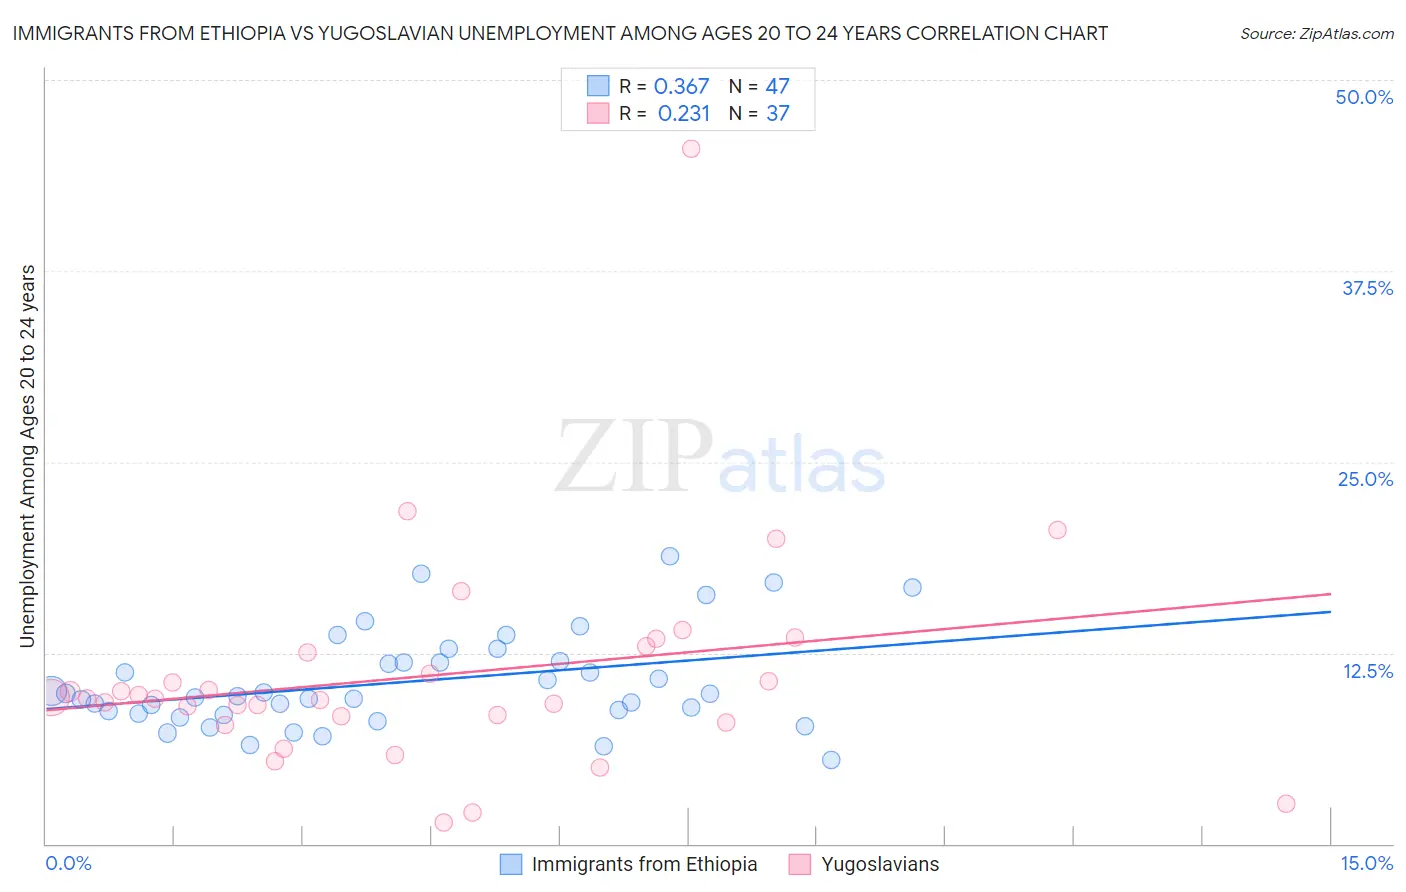
Immigrants from Ethiopia vs Yugoslavian Unemployment Among Ages 20 to 24 years Correlation Chart
The statistical analysis conducted on geographies consisting of 209,163,502 people shows a mild positive correlation between the proportion of Immigrants from Ethiopia and unemployment rate among population between the ages 20 and 24 in the United States with a correlation coefficient (R) of 0.367 and weighted average of 9.6%. Similarly, the statistical analysis conducted on geographies consisting of 278,670,423 people shows a weak positive correlation between the proportion of Yugoslavians and unemployment rate among population between the ages 20 and 24 in the United States with a correlation coefficient (R) of 0.231 and weighted average of 9.6%, a difference of 0.52%.
Unemployment Among Ages 20 to 24 years Correlation Summary
| Measurement | Immigrants from Ethiopia | Yugoslavian |
| Minimum | 5.5% | 1.4% |
| Maximum | 18.8% | 45.5% |
| Range | 13.3% | 44.1% |
| Mean | 10.6% | 11.0% |
| Median | 9.7% | 9.5% |
| Interquartile 25% (IQ1) | 8.5% | 8.1% |
| Interquartile 75% (IQ3) | 11.9% | 12.7% |
| Interquartile Range (IQR) | 3.4% | 4.6% |
| Standard Deviation (Sample) | 3.1% | 7.4% |
| Standard Deviation (Population) | 3.1% | 7.3% |
Demographics Similar to Immigrants from Ethiopia and Yugoslavians by Unemployment Among Ages 20 to 24 years
In terms of unemployment among ages 20 to 24 years, the demographic groups most similar to Immigrants from Ethiopia are Dutch (9.6%, a difference of 0.040%), Afghan (9.6%, a difference of 0.27%), Immigrants from Zaire (9.6%, a difference of 0.33%), Belgian (9.6%, a difference of 0.41%), and German (9.6%, a difference of 0.45%). Similarly, the demographic groups most similar to Yugoslavians are German (9.6%, a difference of 0.080%), Belgian (9.6%, a difference of 0.11%), Immigrants from Zaire (9.6%, a difference of 0.19%), Australian (9.6%, a difference of 0.20%), and Afghan (9.6%, a difference of 0.25%).
| Demographics | Rating | Rank | Unemployment Among Ages 20 to 24 years |
| Immigrants | Zimbabwe | 100.0 /100 | #27 | Exceptional 9.5% |
| Immigrants | Afghanistan | 100.0 /100 | #28 | Exceptional 9.5% |
| Immigrants | North Macedonia | 100.0 /100 | #29 | Exceptional 9.5% |
| Scandinavians | 100.0 /100 | #30 | Exceptional 9.5% |
| Immigrants | Eastern Africa | 100.0 /100 | #31 | Exceptional 9.5% |
| Cambodians | 100.0 /100 | #32 | Exceptional 9.5% |
| Australians | 100.0 /100 | #33 | Exceptional 9.6% |
| Yugoslavians | 100.0 /100 | #34 | Exceptional 9.6% |
| Germans | 100.0 /100 | #35 | Exceptional 9.6% |
| Belgians | 100.0 /100 | #36 | Exceptional 9.6% |
| Immigrants | Zaire | 100.0 /100 | #37 | Exceptional 9.6% |
| Afghans | 99.9 /100 | #38 | Exceptional 9.6% |
| Dutch | 99.9 /100 | #39 | Exceptional 9.6% |
| Immigrants | Ethiopia | 99.9 /100 | #40 | Exceptional 9.6% |
| Swiss | 99.9 /100 | #41 | Exceptional 9.7% |
| Immigrants | Saudi Arabia | 99.9 /100 | #42 | Exceptional 9.7% |
| Menominee | 99.8 /100 | #43 | Exceptional 9.7% |
| Europeans | 99.8 /100 | #44 | Exceptional 9.7% |
| Croatians | 99.8 /100 | #45 | Exceptional 9.7% |
| Immigrants | Nicaragua | 99.8 /100 | #46 | Exceptional 9.7% |
| Immigrants | India | 99.8 /100 | #47 | Exceptional 9.7% |